Signalwatch DOW performance

AC1

Newbie
Messages
9
Likes
0
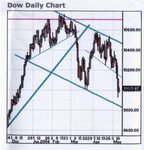
I have attached some results (all trades, sample equity curve and metrics) from testing out the
popularSignalwatch DOW daily commentary from

www.signalwatch.com for the period July 2002 - June 2003.

Brief summary:

Overall Performance (26/7/02 - 30/6/03)

Net Points 2912
Total Trades 229
Expectancy 1.27

% wins 19% (31% if you include beakeven trades as winners)
Avg. Winning Trade 120
Avg. LosingTrade 15.34

Max. Runup 339
Max. Drawdown -220
Consecutive winners 2
Consecutive losers 24
No. Winners 44
No. Losers 157
No. breakeven 28

Average Profit/Month 265
Gross Points 5321
Gross Points 2409

Please do your own research before taking them at face value - there may be some mistakes in the
workings & there are some discrepencies on whether some trades were taken or not, but the results give a
broad idea of what you could have expected DURING THIS PERIOD ONLY.

Anyone done something similar for this past year?

It would be good for Signalwatch to list all the trades that they take so they can be independently
checked for peformance like Mark Brown's Oddball site.

(BTW, I do not work for Nirvana)
 

Attachments

  • signalwatch-dow.xls
    99 KB · Views: 433
Dont mean nothing. Mr ED says go long on a break of lets say 10100, remember he says this the night before, but in real trading the futures might be up 50 points the next day, so you wouldn't get filled at 10100. you be filled some where at 10170. He bases is price on the cash. save you money.

CJ
 
cj12 said:
Dont mean nothing. Mr ED says go long on a break of lets say 10100, remember he says this the night before, but in real trading the futures might be up 50 points the next day, so you wouldn't get filled at 10100. you be filled some where at 10170. He bases is price on the cash. save you money.

CJ

I agree it looks very good in theory but its impossible to trade for real . :mad:
 
Ive looked at signal watch, and the information is fairly basic, but I wouldnt say it was impossible to trade. If it gaps above the price he says to buy at, you either wait until it comes back down and goes back through the point again or you skip the trade.
 
I always check Signalwatch but more out of habit than any practical reason. It works well on trend days but fails on choppy days. 2 years ago we were getting some very nice trend days (up and down) quite regularly, now though the days are much more choppy. They haven't adapted to the changing market very well and I doubt they have made a profit at all in the last year.

The principle is good though and can form the basis of a successful system with some additional filters. As it stands it is worth about as much as they charge for it - nothing!

They also use the cash market rather than the futures and we all know the dangers of basing system results on that.


CJ12 - see rule 1, they do take opening gaps into account. This is not why it doesn't work.
 
I'm always interested in Ed's Dow Market Commentary pages, and his nominated 'fulcrum' levels where he is looking to enter trades; but he seems to get stopped out a helluva lot (always 20point stops, though sometimes 'breakeven') before he finds a trade that 'pulls away'.

Also he seems to miss out on a lot of points once he is in a trade by the trailing stop levels he nominates, also at his 'fulcrum' points.

His latest trade was short from 10180; a very good call as it turns out, and his trailing stop was at 10050 from his last report......! As we know, the index fell to 9860 ish today - will be interested to read later if he kept his stop at 10050 thus missing out on 190 points...!? :mad:

Nevertheless, always an interesting 'free' daily read.... :D
 
Last edited:
Problem is, the stops don't match the strategy. It's a shame, but it is such a basic shortcoming. A 20 point stop onthe dow is fine for intraday 1 min trading. The longer the timeframe the bigger the stop HAS to be, or else you just get stopped out all the time, a la ED. If you're trading 10 min + I suggest you need at least 40 points, and a smaller stake.
 
You’re right CM, Ed’s strategy has some very basic flaws……

Quote from today’s Signalwatch commentary:-

Medium Term Dow
In the medium term, we are still Short the Dow from 10,180, since the 10,050 level barely held late in the day. We will continue holding stops at this level tomorrow. We will stay Short below 9,850, and will look for Longs above 10,050, with 20 point stops.

Yes, he did miss out on those extra 190 points as I suspected…..
It’s not only his stops, but his exit strategy needs looking at…!

Perhaps he should be made aware of Dow Intraday charts…… ;)
 
4 times as many losers as winners and 20+ losers in a row makes it difficult to follow.

Results don't include slippage or commissions. If you were spreadbetting this, a 10 point bias/slippage/spread would drastically cut profits

The spreadsheet results took into account gaps (I saved their commentary page every day for 11 months and checked entry/exits as reported by them against futures charts to record a real trade)

I think most visitors just have a glance at his up/down no.s and trendlines on charts.
 
Interesting that the data they publish on the site is their best. I asked for (and eventually received) a lot more historic data on their trades and it makes for grim reading. Some very long losing runs and huge drawdowns. And that's before adding slippage (but after commissions and spreads). Pretty poor performance overall in the long term. Also, the support on their software is appalling (although I quite like Omnitrader). I sent them 9 support e-mails that went unanswered, at which point I returned the package for a refund. Still waiting for my money back.
 
Almost inevitably, Ed will be reporting later (SignalWatch commentary for today available around 23.30 BST) that he was stopped out for the current short trade from 10180 at his designated ‘fulcrum’ level of 10050. He’ll probably also be reporting that he took a long at 10150 and was stopped out on the pullback!

Still, a 130 point trade is not is not to be sniffed at, but in the light of current index movements it makes you aware that he could easily double his points with a rationalised strategy.

His trendlines from 11-05-04 (see Ed’s chart attached) actually called the bottom at around 9850..! Now if he’d covered and reversed to long at that level he’d be many points ahead..!!!

A revised exit and entry strategy required, I humbly suggest…… :confused:

(Or perhaps he’s trading at $10k per point and it doesn’t matter that much… :cheesy: )

ps - a 1-to-1 with CM might help...... :cool:
 

Attachments

  • Eds Chart 13-05-04.jpg
    Eds Chart 13-05-04.jpg
    15.1 KB · Views: 241
I suspect the free daily Signalwatch commentary is meant more as a marketing tool than a serious system to be followed. If you want the full intra-day alerts it'll cost you $199.95 per month. Aparently this achieved a return of 590% last year.
 
Who knows what his $ per point is, or his capital base, or his risk per trade. All these things, I suspect, dictate his trading strategy. If I had 20K in my account, I'd be scalping YM for a few points here and there at some large %, but still keeping my SB account rolling over... His audience is also non day-trading , I suspect and you have to have a different approach. Still doesn't explain the huge stops and endless missed golden opportunities and countless stopouts.
 
Top