ducati996
Newbie
- Messages
- 6
- Likes
- 4
Stuff that I find interesting from all over the internet. I will steal from everyone, alive or dead.
This is really just a market diary of stuff that is happening day-to-day in the markets. A pulse. I don't necessarily agree or disagree. I don't highlight my opinions, but you will (if you follow this) will come to recognise my voice in the posts.
Friday, September 26, 2025
Moscow’s restrictions on fuel exports, including a full export ban on gasoline and a partial one on diesel, have lifted ICE Brent futures above $70 per barrel this week, further buoyed by market participants distrusting OPEC+’s unwinding of its 2.2 million b/d voluntary cuts, seeing only a fraction of promised barrels in the market. Iraq will be the key price indicator of the upcoming weeks, with the potential restart of oil flows via Turkey adding to Europe’s regional supply.
Iraq Doubles Down on Kurdish Restart. Having signalled the restart of Kurdish crude deliveries via the Kirkuk-Ceyhan pipeline earlier this week, Iraq’s federal government reached agreements in principle with 8 oil companies producing 90% of Kurdistan’s output, specifying that first oil will flow on Saturday.
Russia Extends Gasoline Export Ban. The Russian government extended its ban on gasoline exports until the end of 2025, seeking to keep all barrels at home following a barrage of Ukrainian drone strikes on refineries, whilst also introducing a ban on diesel exports for non-producers, i.e. trading middlemen.
Traders Continue Their Global Expansion. Having previously bought Italy’s Saras refinery and Sweden’s Preem, global trading house Vitol has expanded further into upstream, having finalized its purchase of a 30% stake in Cote d’Ivoire’s multi-billion-barrel Baleine field from Italy’s ENI (BIT:ENI) for $1.65 billion.
Trump Cancels $13 Billion in Renewable Funds. The US Department of Energy plans to cancel $13 billion in funds dedicated by the Biden administration to subsidize wind and solar parks as well as electric vehicles, coming a day after President Trump dismissed climate change as the ‘greatest con job’.
Oil Majors Scale Back 2026 Buybacks. French major TotalEnergies (NYSE:TTE)might have pioneered a new trend of downscaling its share buyback programme next year, with its board voting to restrict quarterly buybacks to $0.75-1.50 billion, down from previous pledges of $2 billion per quarter.
US Drillers Remain Sceptical. The latest Dallas Fed survey on oil and gas activity in key oil-producing states of the US has brought forward the ‘twilight of shale’ as executives voiced their frustration with Trump’s tariff policies, with the company outlook index falling from -6.4 in Q2 to -17.6 in Q3.
Canadian Gas Producers Curb Output. Record low natural gas prices in Canada, with Alberta’s benchmark AECO spot prices trading at an average of -$0.18 per MMbtu this week have prompted the country’s oil and gas companies to aggressively cut output, absent any incremental LNG offtake outlet.
Serbia’s Only Refinery Awaits Its Ordeal. The Trump administration will impose sanctions on Serbia’s Russian-owned oil company NIS from October 1, according to the country’s President Aleksandar Vucic, citing Gazprom Neft’s 44.9% stake in the company that operates the 100,000 b/d Pancevo refinery.
French Unions Look Forward to Week-Long Strikes. France’s largest industrial trade union CGT vowed to disrupt port operations and block ships from discharging until its salary demands are met, prompting terminal operator Elengy to invoke force majeure at three sites, temporarily halting cargo discharges.
BP Scales Back Its Renewable Ambition. Publishing its annual Energy Outlook, UK oil major BP (NYSE:BP) pared back its call of global crude demand peaking in 2025 at 102 million b/d, pushing peak oil out to 2030 (at 103.4 million b/d), blaming the change on weaker-than-assumed energy efficiency gains.
World’s Most Important Copper Mine Grinds to a Halt. US mining giant Freeport-McMoran (NYSE:FCX) declared force majeure at its Grasberg mine in Indonesia, one of the largest copper and gold mines globally, after a landslide blocked access to underground parts of it, trapping seven miners and killing two.
Russia to Build Four Nuclear Plants in Iran. Tehran has signed a $25 billion agreement with Russia’s state nuclear corporation Rosatom to build four nuclear power reactors in the country, with Iranian media suggesting the 5 GW capacity site would be located in the southeastern province of Hormozgan.
Europe Plans Tariffs on Chinese Steel. According to German newspaper Handelsblatt, the European Commission plans to impose tariffs of 25% to 50% on Chinese steel and related products over the upcoming weeks, even though Europe accounts for only 4% of China’s steel exports, as of end-2024.
The historic period of American exceptionalism in the stock market is over.
That ended last year and the rest of the world had been playing catch up throughout 2025.
While the United States stock market is on pace for another epic year, it’s actually one of the worst-performing countries in the world.
That’s not so much a knock on America as it is an impressive run from foreign equities.
But the investors themselves still haven’t pivoted.
Here’s a great chart from our friends over at Ned Davis Research. Foreign investors now have a record allocation to U.S. equities:

This chart shows the value of foreign-held U.S stocks as a percentage of foreign held U.S. financial assets.
It’s never been higher – now above 30%. Notice how this was just 12% 15 years ago.
Foreign investors had little to no confidence in U.S. stocks at the moment when U.S. stocks went on the most important run of global outperformance in stock market history.
Now that this run is over (in our opinion), foreign investors have never had this much faith in U.S. stocks.
Perfect.
I’m happy to take the other side of that.
Based on consensus at the time, everyone assumed Trump 2.0 would be bad for China.
Even the Chinese didn’t want Chinese stocks.
They still don’t.
No one wants Chinese stocks.
I do.
They’re working really well. And my bet is they’ll keep working on an absolute basis and also outperform the U.S.
Just when the rest of the world finally realized how dominant the U.S. stock market has been, we’re flipping that around and letting them have it.
I’ll happily take the foreign equities, thank you.
Stay sharp,


[td] [/td] [td]

Data: Bureau of Economic Analysis; Chart: Axios Visuals
For all the sense of angst about the U.S. economy of late, the American consumer continues powering growth forward.
Driving the news: Personal consumption expenditures rose 0.6% in August, the Commerce Department said this morning, or 0.4% adjusted for inflation.
The bottom line: "The economy has continued to surprise to the upside, and despite the negativity captured in surveys and expressed by commentators, actions speak louder than words and consumers continue to spend," writes Chris Zaccarelli, chief investment officer for Northlight Asset Management, in a note.[/td]
[TR]
[td]
[/td]
[/TR]
[/td]
[/td]
[/td]
[/td]
[/td]
[/td]
[/td]
[/td]
[/td]
[/td]
[/td]
[/td]
[/td]


Full:https://www.wsj.com/world/iran-shah...b?st=oRopKo&reflink=desktopwebshare_permalink

Full:https://paulkrugman.substack.com/p/why-is-trump-bailing-out-argentina

Full:https://quartr.com/insights/edge/american-express-an-empire-of-plastic

Full:https://www.construction-physics.com/p/whats-happening-to-wholesale-electricity
Small-caps, mid-caps, large-caps — the way we've classified companies for decades no longer fits the reality of today's market. The world has moved on, but the numbers everyone keeps using are stuck in the past.
I'm here to update the rules. You don't have to like it. You don't even have to agree with me. But this is where we are now. And if you want to keep up, you'll need to adjust.
So let's start at the beginning. What even is a "small-cap" stock? How small is too small? How big is too big?
According to ChatGPT, a small-cap stock is worth between $300 million and $2 billion. Gemini says the same thing.
Fidelity also says $300 million to $2 billion.
Meanwhile, Wikipedia says it's between $250 million and $2 billion. So does Investopedia.
But, respectfully, they're all wrong.
Near the turn of the century, when I first started in this business, the market-caps were set.
Small-caps are companies between roughly $300 million and $2 billion. Micro-caps were anything smaller than $300 million.
On the other side of the spectrum, large-caps are any stock worth more than $10 billion, while mid-caps are the "Jan Bradys" of the world – anything between $2 billion and $10 billion.
That's it. Those are the levels.
And, to many, these numbers still apply.
"Because we've always done it this way" is the worst excuse a human can use, especially for market professionals.
Take Nvidia (NVDA). At $4.2 trillion, it's worth more than the entire Russell 2000 small-cap index combined. Trillion-dollar companies didn't even exist until 2018, when Apple (AAPL) became the first to cross the mark.
Since then, Microsoft (MSFT), Alphabet (GOOG), Amazon.com (AMZN), Meta Platforms (META), Tesla (TSLA), Broadcom (AVGO), and even Berkshire Hathaway (BRK.A) have joined the club.
The world has changed. Market-cap inflation is real. And if you're still pretending a $10 billion company belongs in the "large-cap" bucket, you're playing a game that no longer exists.
As investors, we have to adjust. Sticking with outdated definitions isn't just lazy. It's dangerous.
Earlier this week, we decided to officially change the rules. Now, small-caps are between $1 billion and $10 billion.
If you're not at a billion, then I can't even take you seriously. Below $1 billion and your stock is a micro-cap.
In the old days (and according to many sources this is still the case), any stock above $10 billion was a "large-cap." That's laughable. By our math, $10 billion still makes you a small-cap.
Officially, a large-cap stock from now on is worth between $30 billion and $200 billion.
And mid-caps are the companies larger than small-caps ($10 billion) but smaller than large-caps ($30 billion). There are currently about 350 companies in the United States that fit this new mid-cap criteria.
Finally, there are 50 companies in America right now worth more than $200 billion. Those are now officially the mega-cap stocks.
At the end of the day, markets evolve, and so should the way we define them. Pretending 20-year-old thresholds still make sense in a world where single companies are worth trillions is lazy at best, irresponsible at worst.
That's why I've redrawn the lines.

Call it market-cap inflation. Call it common sense. Either way, these are the new rules.
Stop clinging to outdated definitions. If you want to navigate today's markets, you need to frame the playing field as it actually exists — not as it did in the 1980s.
Someone had to set the record straight. I just did.
Now the only question is, are you going to keep pretending, or are you going to play by the rules of reality?
Earlier this week, this Substack noted that there was a divergence between market views on precious metals being ‘overbought’ in comparison to data showing that silver and platinum, in particular, are facing extraordinary London shortage in the face of increasing global demand.
The metal shortage in the world’s largest physical precious metals market in London signaled by extreme implied lease rates for silver and platinum and price backwardation tell us that there is a run into physical precious metals.
Gold has the greatest liquidity due to central banks supplying their metal to market and is thus currently showing the least stress.
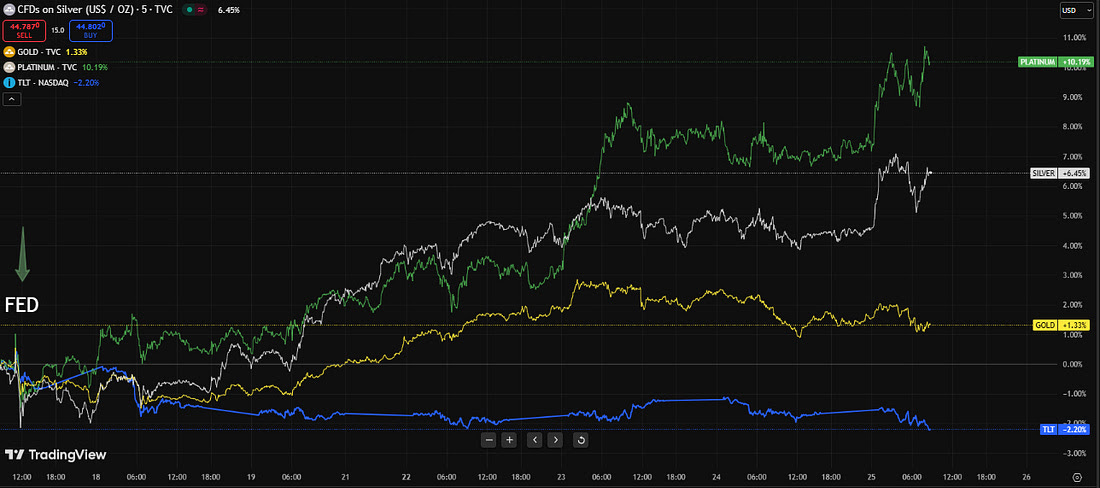
Figure 1 - Long Duration (20 year+) US Treasuries (TLT-NY ETF as Proxy), Gold, Silver, and Platinum Price Trends September 17 to 25, 2025; source: TradingView.com
What we can say is that given the world’s increasing move toward the security of real asset ownership and possession, we can see data showing an accelerated rate of metal demand moving toward sudden failure in the London precious metals market.
Failure of one metal’s leverage scheme in London will likely trigger sequential failure of the others.
Asset quality, ownership, and possession then becomes the primary concern.
jog on
duc
This is really just a market diary of stuff that is happening day-to-day in the markets. A pulse. I don't necessarily agree or disagree. I don't highlight my opinions, but you will (if you follow this) will come to recognise my voice in the posts.
Friday, September 26, 2025
Moscow’s restrictions on fuel exports, including a full export ban on gasoline and a partial one on diesel, have lifted ICE Brent futures above $70 per barrel this week, further buoyed by market participants distrusting OPEC+’s unwinding of its 2.2 million b/d voluntary cuts, seeing only a fraction of promised barrels in the market. Iraq will be the key price indicator of the upcoming weeks, with the potential restart of oil flows via Turkey adding to Europe’s regional supply.
Iraq Doubles Down on Kurdish Restart. Having signalled the restart of Kurdish crude deliveries via the Kirkuk-Ceyhan pipeline earlier this week, Iraq’s federal government reached agreements in principle with 8 oil companies producing 90% of Kurdistan’s output, specifying that first oil will flow on Saturday.
Russia Extends Gasoline Export Ban. The Russian government extended its ban on gasoline exports until the end of 2025, seeking to keep all barrels at home following a barrage of Ukrainian drone strikes on refineries, whilst also introducing a ban on diesel exports for non-producers, i.e. trading middlemen.
Traders Continue Their Global Expansion. Having previously bought Italy’s Saras refinery and Sweden’s Preem, global trading house Vitol has expanded further into upstream, having finalized its purchase of a 30% stake in Cote d’Ivoire’s multi-billion-barrel Baleine field from Italy’s ENI (BIT:ENI) for $1.65 billion.
Trump Cancels $13 Billion in Renewable Funds. The US Department of Energy plans to cancel $13 billion in funds dedicated by the Biden administration to subsidize wind and solar parks as well as electric vehicles, coming a day after President Trump dismissed climate change as the ‘greatest con job’.
Oil Majors Scale Back 2026 Buybacks. French major TotalEnergies (NYSE:TTE)might have pioneered a new trend of downscaling its share buyback programme next year, with its board voting to restrict quarterly buybacks to $0.75-1.50 billion, down from previous pledges of $2 billion per quarter.
US Drillers Remain Sceptical. The latest Dallas Fed survey on oil and gas activity in key oil-producing states of the US has brought forward the ‘twilight of shale’ as executives voiced their frustration with Trump’s tariff policies, with the company outlook index falling from -6.4 in Q2 to -17.6 in Q3.
Canadian Gas Producers Curb Output. Record low natural gas prices in Canada, with Alberta’s benchmark AECO spot prices trading at an average of -$0.18 per MMbtu this week have prompted the country’s oil and gas companies to aggressively cut output, absent any incremental LNG offtake outlet.
Serbia’s Only Refinery Awaits Its Ordeal. The Trump administration will impose sanctions on Serbia’s Russian-owned oil company NIS from October 1, according to the country’s President Aleksandar Vucic, citing Gazprom Neft’s 44.9% stake in the company that operates the 100,000 b/d Pancevo refinery.
French Unions Look Forward to Week-Long Strikes. France’s largest industrial trade union CGT vowed to disrupt port operations and block ships from discharging until its salary demands are met, prompting terminal operator Elengy to invoke force majeure at three sites, temporarily halting cargo discharges.
BP Scales Back Its Renewable Ambition. Publishing its annual Energy Outlook, UK oil major BP (NYSE:BP) pared back its call of global crude demand peaking in 2025 at 102 million b/d, pushing peak oil out to 2030 (at 103.4 million b/d), blaming the change on weaker-than-assumed energy efficiency gains.
World’s Most Important Copper Mine Grinds to a Halt. US mining giant Freeport-McMoran (NYSE:FCX) declared force majeure at its Grasberg mine in Indonesia, one of the largest copper and gold mines globally, after a landslide blocked access to underground parts of it, trapping seven miners and killing two.
Russia to Build Four Nuclear Plants in Iran. Tehran has signed a $25 billion agreement with Russia’s state nuclear corporation Rosatom to build four nuclear power reactors in the country, with Iranian media suggesting the 5 GW capacity site would be located in the southeastern province of Hormozgan.
Europe Plans Tariffs on Chinese Steel. According to German newspaper Handelsblatt, the European Commission plans to impose tariffs of 25% to 50% on Chinese steel and related products over the upcoming weeks, even though Europe accounts for only 4% of China’s steel exports, as of end-2024.
| Small-caps are stepping into the spotlight after sitting on the sidelines for a long stretch. These stocks have been waiting for their moment, and it looks like that moment is finally here. The Russell 2000 ETF just closed at new all-time highs for the first time in 969 days — ending its longest drought ever. In fact, the Russell 2000 ETF finally closed at new all-time highs for the first time in 969 days — ending its longest drought ever. |
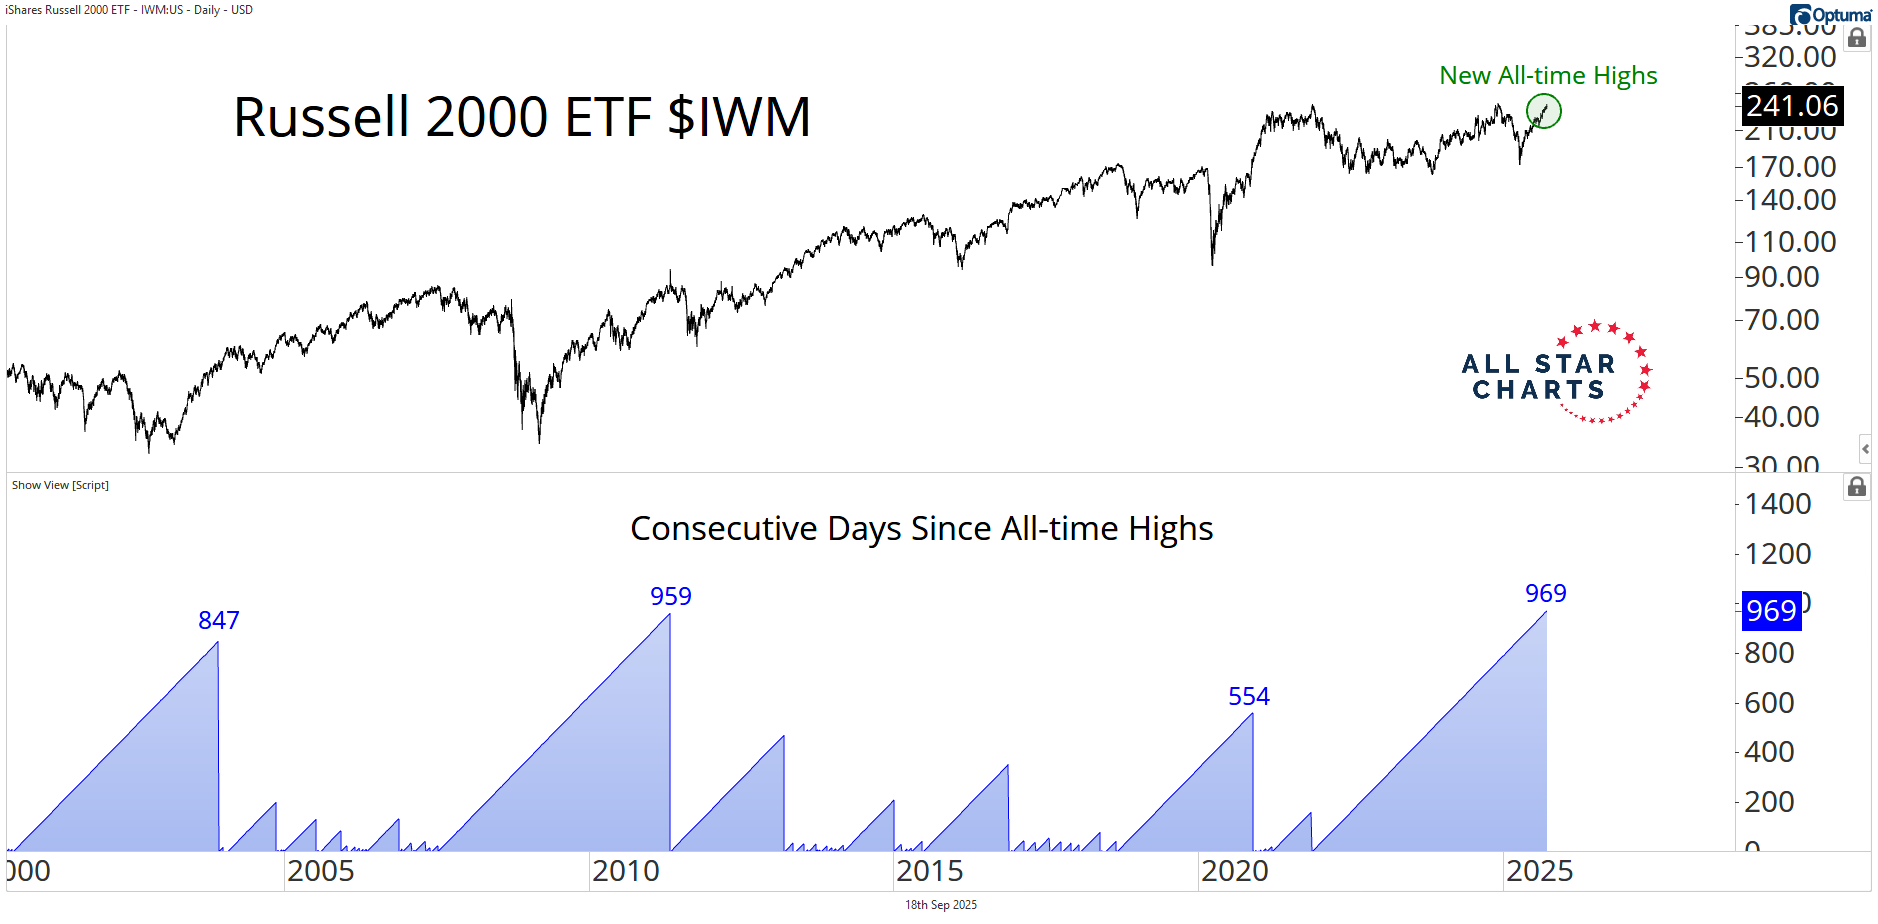 |
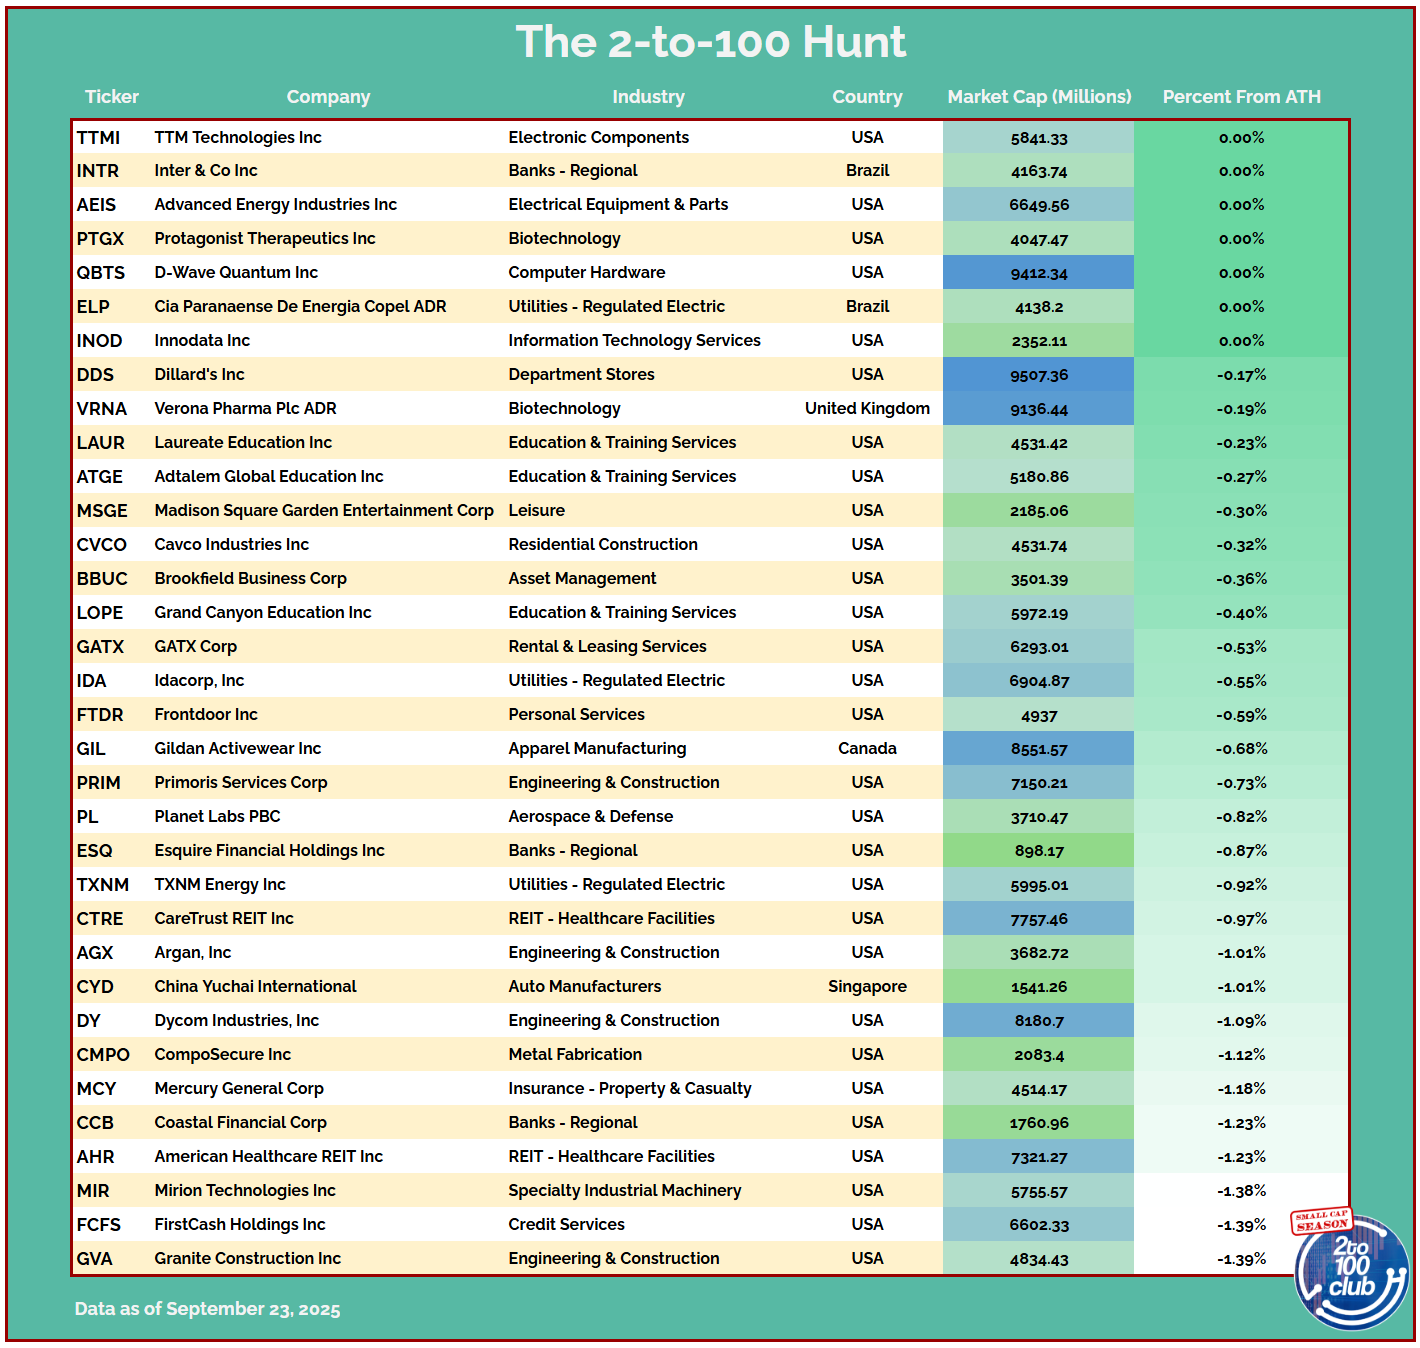
Now it’s their turn to go on offense and prove they can sustain this strength. If small-caps can keep leading from here, it would be a huge confirmation of risk appetite and a fresh tailwind for the broader market into the year-end. A lot of these names are already participating — Industrials, Tech, Gold miners. These are offensive groups pushing higher. And really, it’s tough to picture this bull market wrapping up before small-caps even register a clean breakout. That’s been a key reason we’ve stayed constructive and eager to keep putting money to work in equities. Our Chief Market Strategist Steve Strazza walked through this yesterday in a live session, highlighting actionable setups. One standout: the 2-to-100 Hunt. |
 |
|
- The S&P 500 ($SPX) fell for the third straight day, but the pullback has been mild, slipping just -2% on an intraday basis and -1.3% on a closing basis.
- Frank notes that short-term momentum swiftly corrected from extremely overbought levels on Monday to nearly oversold levels. Importantly, it didn't quite reach oversold today, indicating a resilient underlying bid.
- Before pulling back, RSI confirmed the last all-time high on Monday, rather than diverging like it typically does before significant tops. However, immediate follow-through is necessary, and a potential oversold reading would suggest a deeper pullback than the previous ones.
The historic period of American exceptionalism in the stock market is over.
That ended last year and the rest of the world had been playing catch up throughout 2025.
While the United States stock market is on pace for another epic year, it’s actually one of the worst-performing countries in the world.
That’s not so much a knock on America as it is an impressive run from foreign equities.
Foreign Investors Didn’t Get the Memo
We have the data. We see the changes in dynamics between U.S. and foreign markets.But the investors themselves still haven’t pivoted.
Here’s a great chart from our friends over at Ned Davis Research. Foreign investors now have a record allocation to U.S. equities:
This chart shows the value of foreign-held U.S stocks as a percentage of foreign held U.S. financial assets.
It’s never been higher – now above 30%. Notice how this was just 12% 15 years ago.
Foreign investors had little to no confidence in U.S. stocks at the moment when U.S. stocks went on the most important run of global outperformance in stock market history.
Now that this run is over (in our opinion), foreign investors have never had this much faith in U.S. stocks.
Perfect.
I’m happy to take the other side of that.
China Bull
When it became obvious last fall that Donald Trump was going to win by a landslide, the question was simple: What’s the trade?Based on consensus at the time, everyone assumed Trump 2.0 would be bad for China.
Even the Chinese didn’t want Chinese stocks.
They still don’t.
No one wants Chinese stocks.
I do.
They’re working really well. And my bet is they’ll keep working on an absolute basis and also outperform the U.S.
Just when the rest of the world finally realized how dominant the U.S. stock market has been, we’re flipping that around and letting them have it.
I’ll happily take the foreign equities, thank you.
Stay sharp,
[td] [/td] [td]
Data: Bureau of Economic Analysis; Chart: Axios Visuals
For all the sense of angst about the U.S. economy of late, the American consumer continues powering growth forward.
- New data out this morning confirms that trajectory continued through late summer.
Driving the news: Personal consumption expenditures rose 0.6% in August, the Commerce Department said this morning, or 0.4% adjusted for inflation.
- The spending bump was particularly strong for physical items, with a 0.8% rise in both durable and nondurable goods.
- Personal income rose as well, though only by 0.4%, meaning that the higher spending was fueled by a lower savings rate.
- It follows on the heels of revisions to second quarter GDP, released yesterday, that showed much stronger consumer spending in the April through June quarter than first estimated, and a 3.8% pace of growth.
- "And why wouldn't they?" Barkin continued. "Unemployment is still low, nominal wages are still increasing, and asset valuations are near all-time highs."
- As our colleague Emily Peck has reported, there is a range of evidence indicating that it is affluent Americans propping up spending, even as lower-income people are pinching pennies more.
- Those low-income groups are less likely to have rising wealth thanks to the booming stock market, and more likely to be financially stressed by tariff-fueled inflation.
- Confirming the bad vibes, the University of Michigan consumer sentiment survey for September, out this morning, fell 5% from August and is down 21.6% from a year ago.
The bottom line: "The economy has continued to surprise to the upside, and despite the negativity captured in surveys and expressed by commentators, actions speak louder than words and consumers continue to spend," writes Chris Zaccarelli, chief investment officer for Northlight Asset Management, in a note.[/td]
|

|

|
|
|
|
|
|
|
|
[td]
|
[/td]
[/TR]
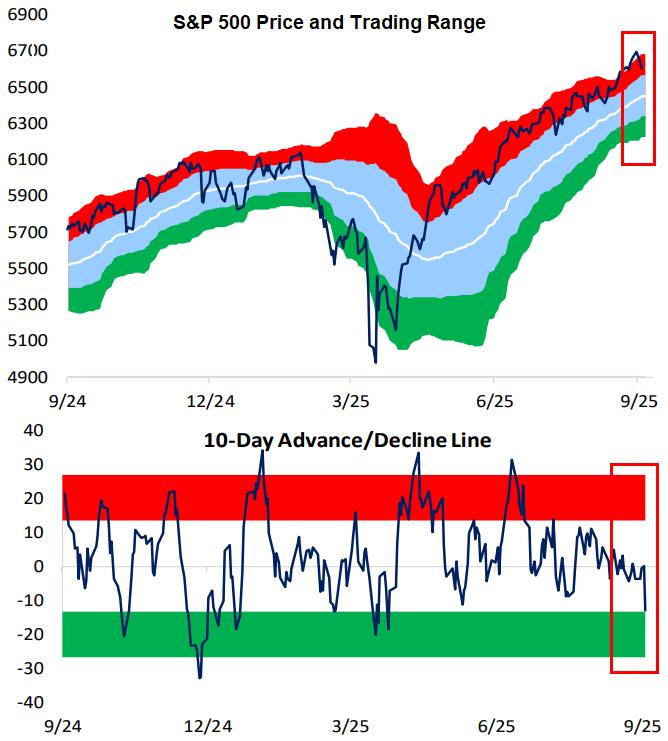
[td]While the S&P 500 remains overbought in price (>1 standard deviation above its 50-DMA), its 10-day advance/decline line actually moved near oversold territory yesterday. The 10-day A/D line measures the average number of daily advancers minus decliners in an index over the last ten trading days. It's a helpful measure of short-term market breadth. When the 10-day gets overbought, it's a sign that stocks have had a large upward thrust over the last two weeks, often preceding some downside mean reversion. The opposite is also the case: when the 10-day gets oversold, it's a sign that stocks within an index have struggled in the short-term, and thus upside mean reversion may be in store. Usually, an index's price and its 10-day track each other, but for the top-heavy S&P, there can be divergences because of how large the mega-caps have become. Because the mega-caps have held up well over the last two weeks, it has masked underlying weakness in the majority of stocks. From a mean reversion perspective, the oversold 10-day suggests that the average stock could be in store for a bounce, while the mega-caps causing the S&P's price to remain overbought could take a breather. |
[/td]
[/td]
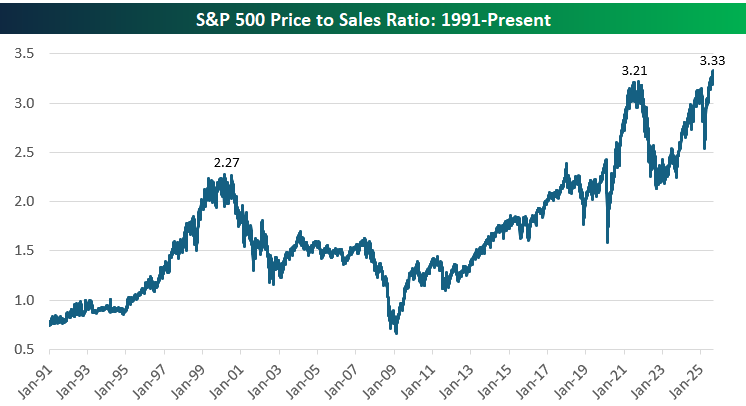
[td]Record High Price to Sales, But With a CatchAs shown below, the S&P 500’s price-to-sales ratio has climbed to historically elevated levels, recently hitting 3.33. For context, the Dot-Com bubble peak in 2000 topped out at 2.27, and the post-COVID boom peaked at 3.21 before valuations pulled back. While strong corporate profitability and the AI growth theme have gotten us to these levels, this chart highlights just how extended valuations have become relative to revenues. |
[/td]
[/td]
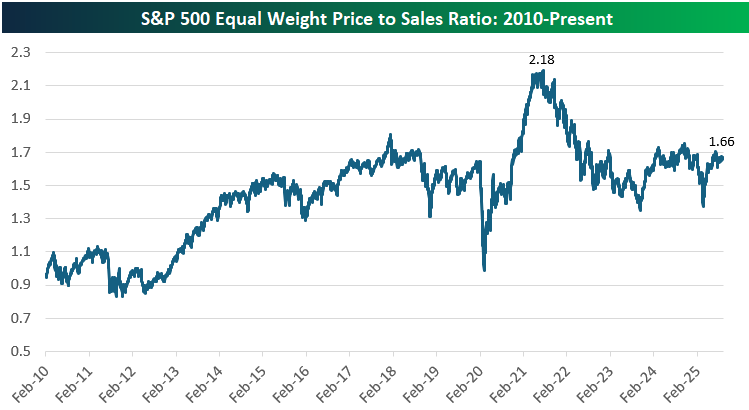
[td]But there's also a catch... The equal-weighted version of the S&P 500 tells a different story, with its price-to-sales ratio currently sitting at 1.66, well below its 2021 peak of 2.18. This highlights the outsized role that mega-cap stocks have played in driving overall index valuations higher, as the typical stock trades at a much more modest multiple of sales compared to the market-cap-weighted index. While still elevated relative to the early 2010s, the equal-weight P/S ratio is right in the middle of its 12-year range. While valuation excesses are concentrated in the largest companies, much of the broader market is trading at far more reasonable levels. |
[/td]
[/td]
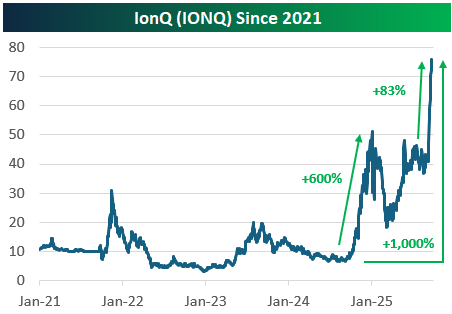
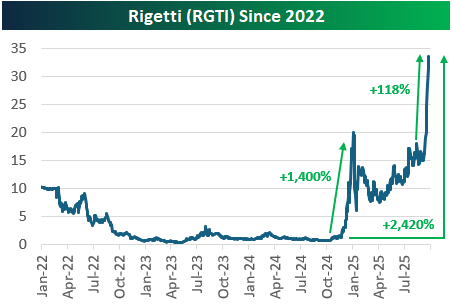
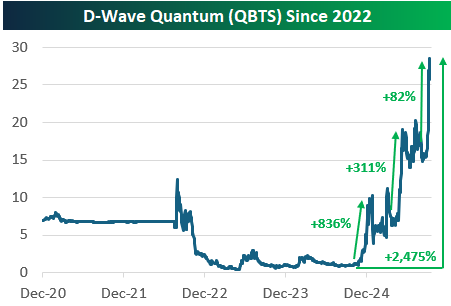
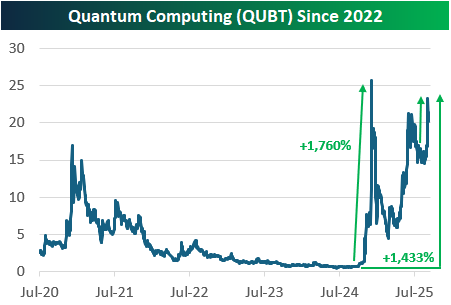
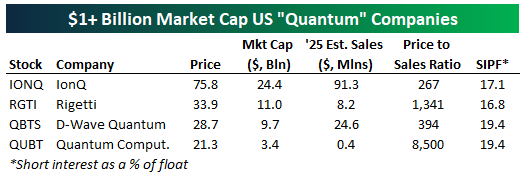
[td]Quantum Stocks SurgeQuantum computing stocks have had another parabolic run recently. There are now four "quantum" stocks with market caps in the billions, and we provide recent price charts of them below. IonQ (IONQ) is up the least of the bunch with a gain of 1,000% since its lows late last year. Quantum Computing (QUBT) is up the 3rd most with a gain of 1,433%, while Rigetti (RGTI) and D-Wave Quantum (QBTS) are both up more than 2,400%. |
[/td]
[/td]
[/td]
[/td]
[/td]
[td]At their core, these "quantum" companies are working on the long-term promise of quantum computing: leveraging quantum mechanics to perform computations exponentially faster than today’s computers. The technology has the potential to transform industries such as cryptography, pharmaceuticals, and logistics, but the reality is that commercial viability remains decades away. Systems are still experimental, error-prone, and difficult to scale, with many breakthroughs required before they can solve real-world problems at scale. That hasn't stopped speculators from bidding up quantum stocks to ungodly valuations, though. As shown below, IONQ is projected to do $91.3 million in sales this year, which is the most of the group. Its market cap is all the way up to $24.4 billion, however, which gives it a price to sales ratio of 267! And that's the smallest P/S ratio of the four stocks shown. 2025 sales estimates for RGTI are $8.2 million, while they're $24.6 million for QBTS and just $400k for QUBT. |
[/td]
[/td]
| Nobody wants to talk about coal. Politicians hate it, ESG funds avoid it, and climate activists want it banned yesterday. Yet coal still powers ~35% of the world’s electricity (IEA, 2024). China alone consumes more coal than the rest of the world combined. India continues to build coal plants because renewables can’t keep up with demand growth. Even Europe — the poster child for clean energy rhetoric — quietly boosted coal imports after the Russia-Ukraine war disrupted natural gas supplies. And investors who ignored the narrative and just watched price action? They’ve been rewarded. Look at the Dow Jones Coal Stock Index. |

|
After years of being left for dead, it’s broken out to multi-year highs (Black Line). That’s not a dead cat bounce. That’s demand showing up in price. On the multi colored bar chart (Top) you can also see that it is outperforming the US SPY ETF this year. The seen is AI stocks. The unseen is that every AI server farm, every data center, every Tesla charging station is powered by electricity that — in no small part — still comes from coal. |
Full:https://www.wsj.com/world/iran-shah...b?st=oRopKo&reflink=desktopwebshare_permalink
Full:https://paulkrugman.substack.com/p/why-is-trump-bailing-out-argentina
Full:https://quartr.com/insights/edge/american-express-an-empire-of-plastic
Full:https://www.construction-physics.com/p/whats-happening-to-wholesale-electricity
- As investors, we either adapt or we fail.
- We've changed some definitions.
- We play based on reality.
Small-caps, mid-caps, large-caps — the way we've classified companies for decades no longer fits the reality of today's market. The world has moved on, but the numbers everyone keeps using are stuck in the past.
I'm here to update the rules. You don't have to like it. You don't even have to agree with me. But this is where we are now. And if you want to keep up, you'll need to adjust.
So let's start at the beginning. What even is a "small-cap" stock? How small is too small? How big is too big?
According to ChatGPT, a small-cap stock is worth between $300 million and $2 billion. Gemini says the same thing.
Fidelity also says $300 million to $2 billion.
Meanwhile, Wikipedia says it's between $250 million and $2 billion. So does Investopedia.
But, respectfully, they're all wrong.
"We've Always Done It This Way"
Near the turn of the century, when I first started in this business, the market-caps were set.
Small-caps are companies between roughly $300 million and $2 billion. Micro-caps were anything smaller than $300 million.
On the other side of the spectrum, large-caps are any stock worth more than $10 billion, while mid-caps are the "Jan Bradys" of the world – anything between $2 billion and $10 billion.
That's it. Those are the levels.
And, to many, these numbers still apply.
"Because we've always done it this way" is the worst excuse a human can use, especially for market professionals.
Take Nvidia (NVDA). At $4.2 trillion, it's worth more than the entire Russell 2000 small-cap index combined. Trillion-dollar companies didn't even exist until 2018, when Apple (AAPL) became the first to cross the mark.
Since then, Microsoft (MSFT), Alphabet (GOOG), Amazon.com (AMZN), Meta Platforms (META), Tesla (TSLA), Broadcom (AVGO), and even Berkshire Hathaway (BRK.A) have joined the club.
The world has changed. Market-cap inflation is real. And if you're still pretending a $10 billion company belongs in the "large-cap" bucket, you're playing a game that no longer exists.
As investors, we have to adjust. Sticking with outdated definitions isn't just lazy. It's dangerous.
The New Rules
Earlier this week, we decided to officially change the rules. Now, small-caps are between $1 billion and $10 billion.
If you're not at a billion, then I can't even take you seriously. Below $1 billion and your stock is a micro-cap.
In the old days (and according to many sources this is still the case), any stock above $10 billion was a "large-cap." That's laughable. By our math, $10 billion still makes you a small-cap.
Officially, a large-cap stock from now on is worth between $30 billion and $200 billion.
And mid-caps are the companies larger than small-caps ($10 billion) but smaller than large-caps ($30 billion). There are currently about 350 companies in the United States that fit this new mid-cap criteria.
Finally, there are 50 companies in America right now worth more than $200 billion. Those are now officially the mega-cap stocks.
At the end of the day, markets evolve, and so should the way we define them. Pretending 20-year-old thresholds still make sense in a world where single companies are worth trillions is lazy at best, irresponsible at worst.
That's why I've redrawn the lines.
Call it market-cap inflation. Call it common sense. Either way, these are the new rules.
Stop clinging to outdated definitions. If you want to navigate today's markets, you need to frame the playing field as it actually exists — not as it did in the 1980s.
Someone had to set the record straight. I just did.
Now the only question is, are you going to keep pretending, or are you going to play by the rules of reality?
Earlier this week, this Substack noted that there was a divergence between market views on precious metals being ‘overbought’ in comparison to data showing that silver and platinum, in particular, are facing extraordinary London shortage in the face of increasing global demand.
The metal shortage in the world’s largest physical precious metals market in London signaled by extreme implied lease rates for silver and platinum and price backwardation tell us that there is a run into physical precious metals.
Gold has the greatest liquidity due to central banks supplying their metal to market and is thus currently showing the least stress.
Since the September 17, 2025 US Fed announcement that it was further lowering interest rates, which will further debase the US dollar (USD), long duration US Treasuries (using the ‘TLT’-NY 20 year+ Treasury ETF as a proxy) are 2.20% lower while gold’s price is +1.4%, silver is +6.5%, and platinum is 10.2% in USD terms.The world is selling bonds and securing precious metals at an increasing rate.
[td]
[/td]
[/td]
Figure 1 - Long Duration (20 year+) US Treasuries (TLT-NY ETF as Proxy), Gold, Silver, and Platinum Price Trends September 17 to 25, 2025; source: TradingView.com
The Global Run On Physical Precious Metals Is Terminal To The Leveraged London Cash Metal Market
In 2025, gold priced in USD is up 41%, silver is up 52% and platinum is up 63%. Compare those returns to bond yields.As noted above, the London silver market is also showing signs of silver supply distress.Bruce Ikemizu Chief Director of the Japan Bullion Market Association (JBMA) reports that this year through August, Chinese customs data show that China is importing platinum at a run rate of 58% of global mine supply.Further market data show that US COMEX vault holdings have surged from 140,000 oz. to 600,000 oz. while liquid available vault holdings of platinum in London appear near zero.
Data from the London precious metals markets are intentionally opaque and exact timing is impossible to predict.The leverage scheme in London where several times the annual mine supply of precious metals are extant as cash/spot ownership claims for bars of physical gold, silver, platinum, and palladium creates a situation that is extremely unstable as the world moves from paper to real assets in response to decades of central bank and bullion bank monkey businessdestabilizing global metals markets, bond markets, and the global economy.
Unless the markets are suspended from war or a market panic generated to sell-off assets in general, the London precious metal market is moving toward a rapid failure or rupture.
What we can say is that given the world’s increasing move toward the security of real asset ownership and possession, we can see data showing an accelerated rate of metal demand moving toward sudden failure in the London precious metals market.
Failure of one metal’s leverage scheme in London will likely trigger sequential failure of the others.
Asset quality, ownership, and possession then becomes the primary concern.
jog on
duc
Last edited by a moderator: