See it now

cannonball adderley - mercy, mercy, mercy

You know, sometimes we’re not prepared for adversity. When it happens sometimes we’re caught short. We don’t know exactly how to handle it when it comes up. Sometimes we don’t know what to do when adversity takes over. And I have advice for all of us. I got it from my pianist Joe Zawinul who wrote this tune. And it sounds like what you’re supposed to say when you have that kind of problem. It’s called ‘mercy, mercy, mercy’.
 
Looks like no more takers, so . . .

Quote:
Originally Posted by Szimba
If this game is free for everyone,than here is my view:

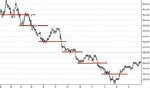
1: Price denied to close back under the previous SL created by bars number 4-5-6. Indicates that traders were interested int hat price to buy.

2: This the retest of the potential support from point number 1. Since at this point buying pressure lift price that is what makes point 1 and 2 significants.

3,5,6: All of them are retests of the SH made between point 1 and 2. Every time price declined from this area, that is what gives significance to point 8, where price finally managed to elevated higher by buyers.


So far, so good. Nice job. Your focus is on what's in front of you rather than on what's going to happen next or on what you think you should be doing about it.

Quote:
4,7 : Nothing special. Just pullbacks int h middle of a range.


Oops. What's special about 4 is that (a) it's a higher low and (b) if it holds, you've defined your trend. What's special about 7 is that it's an even higher low, and push is coming to shove. The release of all that pent-up energy at 8 is a confirmation of all that has come before. Note also the ease with which price rises during that portion of 8 before which there are no immediately-preceding trades. This creates an air pocket.

Quote:
9: This is the test of S from 3-5-6 and as buyers stepped back in one can reasonable expect at least the retest of the SH between 8 and 9. The action is significant as it happens on support!


Note also that it "fills" the pocket. Price is not required to move all the way back to the line drawn by the trader.

Quote:
10,11,12,13 The continuation of the trend through previous SHs.


Worth noting, though, that price at 10/11 makes a higher high, confirming the ongoing trend. The red portion again represents another pocket.

As for 12/13, here, finally, volume becomes significant (the volume that is grayed out is grayed out for a reason) and worth paying attention to. Price closes off the highs, buying pressure is insufficient at 13 to push price higher and trading activity is less (i.e., sellers have little trouble preventing price from making a new high; if they had had more trouble doing so, trading activity would have been higher). All of this suggests the last of the distribution.

Quote:
14: This is a significant point as this is represent the break of the uptrend, break uf potential support from the SH between 8 and 9 and here we also have a lower high and a lower low now.


The uptrend isn't broken quite yet. 14 is there to point to that 5-7 bar consolidation just below the high. In a longer bar interval, this would be a doji. This is a fish-or-cut-bait point. The uptrend is broken between here and 15.

Quote:
15: price finds support as selling exhausted for the moment and buyers pushed the price up to previous support now resistance at 16.

17 ,18 sellers won and price decline didn’t manage to stop not even at potential support that originated from 3-5-6-9.


And the plunge itself confirms the importance of all that had been thought to be support, in addition to defining the trend reversal.

Quote:
20,22 significant points as price here tested previous support from 15 and finally turned south as selling interest was heavy from market participants. Price declined until found enough buying interest at 24 and 25.


And here again volume becomes important for only the second time in the chart. Trading activity is far less at 25. That plus what can now be seen as an SC at 24 suggests that sellers are done. This is confirmed by the character of the bar that prints three bars after 25.

Quote:
Regards
Szimba


Thanks for playing.

Db
firewalker99 said:
I think a lot of the points are significant if you place them in the context of what happened next. I'm not sure how you're going to exploit the things you see while they're developing at the moment itself. After you've been able to indicate it was indeed a significant point, it will already have passed. Also, how would one profit from identifying significant points in hindsight?
:confused:

Assuming 3 had been regarded as an upward break, then left of 4 would have been the first swing low with a long entry around the blue line depending on your rules, then another left of 7 and another left of 9 (you might have been shaken out by 9 if making a more aggressive entry here).

The next potential swing low left of 14 failed but did signal the trend change (blue elipse) and the aggressive would have stopped and reversed here. On a purely mechanical basis 16 didn't make it as a swing high - although it clearly is in hindsight - and the next one was 20 although you might have been shaken out by 22 which - clear in highsight again - was the true swing high at this point.

Assuming you were still short, or had re-entered short after 22, there was nothing mechanical to cause you to cover at the 25 point and that would have had to rely on having the skill to conduct the sort of analysis you have given.

mmm.

good trading

jon
 

Attachments

  • untitled.GIF
    untitled.GIF
    60.3 KB · Views: 209
Last edited:
.
Szimba said:
Whether one plays reversals, breakouts or retracements here are the entry points what I see:

1 Reversal from support

2 Reversal from resistance

3 Breakout

4 Retracement to resistance

5 Retracement to resistance

If someone plays all or only one of them is only up to his trading strategy. Since I'm trading retracements, I would only enter 4 and 5.

Maybe there would be additional entry points if we could see the context from the previous days or weeks or whatever is here the bars represent.

I call reversal when price reverses from the boundary of a range. Retracement is when price reverses the direction in trend.
 

Attachments

  • fwImage8.JPG
    fwImage8.JPG
    40.4 KB · Views: 217
knowledge, objectivity

"Some people hate the very name statistics, but I find them full of beauty and interest. Whenever they are not brutalized, but delicately handled by the higher methods, and are warily interpreted, their power of dealing with complicated phenomena is extraordinary. They are the only tools by which an opening can be cut through the formidable thicket of difficulties that bars the path of those who pursue the Science of man." — Francis Galton, Natural Inheritance, (1889)
 
Knowing

.Gary, I will try not to intrude too much on your thread with my response. I feel compelled to reply.

In my opinion, discussing edge is a lot like discussing trend. There is no definitive answer. Some might say that an uptrend trend is in effect with higher highs-higher lows and point to a chart. But when another person looks at the chart, they might recognize a non-trending market or even a downtrend depending on their own perspective and timeframe.

The biggest traders in the world made money before a bunch of quants came in and told them when to buy or sell to have a statistical edge. Do you think that Lewis J. borsellino has lost his edge in the pit if he went there and traded today? Do you think that while he was trading, he knew his edge through backtesting? No, I don't think so. He traded a method. He never knew if he had an edge today on price or not. He did what you are doing which is to follow a method and, more importantly, know his strengths, his weaknesses and those of his competitors across the pit and on the screens.

All this stuff about backtesting, Sharpe, etc is well and good for a certain type of trader. In the end, many forget that this is an auction market. It runs the exact same way a cattle auction or an auction at sotheby's runs. It is based on price discovery to probe for interest by buyers and sellers and then participation by others who feel that the supply/demand sentiment has changed. That's the simple reality of it. You end up with price as a data point, time as a data point and quantity as a data point.

From there, all kinds of simple and absolutely absurd analyses can be done and some conclusions are derived based on that. But remember, this information is in the past. However, price discovery and the auction are happening here and now as you trade. This is where it is important to understand the bigger picture of what the major money is probing for and then going along with that goal as pieces of the puzzle fall in place with every contract traded.

Trading without a perspective of how the market feels about every price as it goes through the discovery process is a dangerous thing. It puts you in a vacuum and does not allow you to see the story as it is written.

Your edge, Gary, may be the fact that you know how you screwed up in the past and the pain that went with that. So you know when to avoid trading, how much leeway the market gets on your bias and what your emotions are when you are in a trade. This is the biggest struggle for those who don't automate (like myself); understanding their own attachment to winning/losing money and then doing something about it.

I have come to believe, over the years, that every method will probably make money if it is based on KNOWING rather than BELIEVING the overall probable outcome. This means that one has to do his own homework and test his own theories against the momentum of the market. One can get by if he simply followed someone else's plan, but one cannot stick to something that might momentarily not work. This is a crucial fact.

The questions that are important to your method might be: why would breaking a S/R level cause participants to seek higher prices? Why would participants see my current S/R level as a fair price (this is what the market spends all of its time looking for) and will therefore bounce from it? In what situations would my S/R level be broken only to create a hammer or hanging man and head right back into its prior range?

The main momentum of the market is created by people. This is who analyzes, factors in and attempts to account for as much political, technical, environmental and other data as possible into a decision. Everyone else is just seeing the prints on the tape and then jumping along for the ride. Hence, it is ultimately the edge that cannot be backtested that generates the movement which all the backtested and "edge-ful" systems will follow along and exaggerate. Does that make sense?

Again, this is just my opinion and theory. My opinion changes with time and as I learn along the way. I know a few good traders, big ones, and I feel that their edge is what I described in addition to many others too long to list. These are the guys who move the market and sometimes follow it. They wouldn't know what a backtest is and why you would ever need one. This, of course, is strictly a function of style. Everyone has his own.

I hope that helps.

ft71

I learned that the game is not about $$ taken but how professionally and perfectly you executed your trades.
 
Last edited:
mayor aspects

Risk Management
Money Management
Methodology
Psychology (discipline, attitude, etc)
Technical Structure (network, equipment, etc)

These have to be addressed by your business plan. Money management should include your cost structure (commish, tick value) as well as the traditional sizing method. Methodology is something that must evolve with time and can be discretionary. The rest are self-explanatory.
 
http://www.maoxian.com/archivecat.html

Quote from Babak:

Look for unusual price/volume denoting a liquid and volatile stock

Wait for either an inside candle or a counter trend candle to form. This is your 'signal' candle.

Go with the trend and enter above/below the signal candle (as trend would dictate) and place your stop (above/below).

Manage trade (trail stop loss, take stop loss, take overnight, sell at eod, etc.)

If after signal candle price does not move in direction anticipated (and your buy/sell stop isn't triggered) its a scratch and you move on.

CM uses 30 minute candles but you could technically use smaller time frames.

Have I left anything out?
q
1) Why would you be paying attention to this stock?
2) Is the trend up or down? Would you be looking to get long or short this stock?
3) Where would you get long/short this stock?
4) Where would you put the initial protective stop?
5) When would you stop trading for the day?
6) Where would you exit the position?

a:

1) Because it was unusually active, and very volatile.
2) Context Up? You'd be looking long.
3) Long at 1.90 on a buy stop above the xxx yyy bar.
4) Initial Protective Stop: below xxx yyyy bar
5) Right after you enter the position or lunchtime, whichever comes first.
6) End of day. Could sell half, carry half, or just close it all at once.
 
Last edited:
What to look at when scalping

Before you even look at the screen, you should get a print out of the contract specifications of the contract you are trading. Know what the contract is made up of. What will effect this product? How does it relate to other similar products? If it is a stock, you should know what is correlated with and what the company profile is. You should know this stock's players very well and what happens when they get involved in one direction or another. For a futures contract, know the expiration, know when it rolls over, know the top 5 or 10 most heavily weighted underlying issues or stocks, know the tick value, the spread, the daily limits and just about everything else. Don't trade without knowing these. You can be wiped for missing an important detail. Be smart and research before you click.

If you are just starting out in scalping, don't look for the answers on the screen. The first step is to pay attention to the kind of conversation you are having with yourself while you are watching the screen. Are you there for exhiliration or is there a method to your trading?
The next thing to look for is the probability of you making money on the next trade.... if your answer is "yes", then you might consider dealing with your ability to be honest with yourself and putting your ego at bay. Your ego is your greatest enemy in this game.

If your answer is "no", then you are on the right track and you need to come up with a detailed and written out risk plan. This is the scalper's best friend. A good solid risk plan for handling losers, retracements and drawdowns. Once you have figure these out, you will need to paper trade long enough to become proficient with the software you are using. Beyond that, paper trading is just a form of entertainment.

You will also need to keep a record of your trades. You will need to do some kind of a lineout at the end of each day. Put a daily down limit even while on the sim to make it a bit more realistic.

Once you get all that figured out, you have tackled 2% of what you need to make some good money at a lower risk. If you want specific answers, you will need to ask specific questions.

Good luck.
ft71
 
Top post

jm99 said:
I don't think market behavior changes though in that it is normal for markets to go through phases of congestion and trend (70:30 approx) at differing levels of volatility (range expansion/contraction) on any one time frame. When testing a system it needs to be know imo how the system performs in each type of market condition Roughly speaking, the "type of market" can be split into the following categories.

trending up and volatile,
trending up and quiet,
trending down and volatile,
trending down and quiet,
non trending/sideways and volatile
non trending/sideways and quiet

also, add "normal" to all of the above. system performance will vary greatly depending on the market condition and I've never seen a system that is profitable in all type of markets (yet :)) There is no point backtesting a system with data from a trending an volatile market and expecting the system to work in a sideways and quiet market.

eg 1998 - 2002 there was a massive pick up in volatility for sp, compared with recent previous years and the market was trending up then down. If this data was used to compile a system and that system was then applied to the 2003-2006 sp market (where volatility completely dropped off (until recently) and trend was up/sideways) it is unlikely to perform. Another recent example is gold, where there was volatility explosion this year. any systems that were tested on previous data (ie when the market was quiet) would have likely fallen down when the trend and volatility took off. when backtesting I try to categorize data to type of market condition and use trend and volatility filters.
 
This guy sounds prepared.

"If you make a bad trade, you have money management, you have a whole bunch of things that will come to your aid, and you're really not in so much trouble if you make a bad trade. If you miss good trades with any regularity you're finished, you're doomed in this game."

June 29, 1996
Ritz Carlton Hotel

Address by William Eckhardt
President, Eckhardt Trading Company

At Eckhardt Trading Company ("ETC") we try to take a scientific approach to trading. This is not an easy description to live up to. We try to earn it by paying a lot of attention to the foundations of the subject, to the soundness of our methodology, and to the correctness of our statistics.

In terms of the foundations of the subject, we rely heavily on Decision Theory and Utility Theory. To see the usefulness of this, first note that there are two respects in which profits and losses are not equivalent. One is objective and has to do with nonlinearity. For example, it requires a 100% profit to balance a 50% loss. The second is subjective and has to do with risk aversion, for many people even the prospect of a 150% profit does not compensate for the risk of a 50% loss. Through Utility Theory, such imbalances can be treated in a rigorous, quantitative manner and in this way uniform and unified procedures can be developed. Look at the question of risk management. Any trader who survives any length of time knows something about his subject, but in my experience, traders simply graft risk control on top of whatever else they are doing, often in an arbitrary way. For instance, many prospective clients have asked me what’s the most I’ll lose on one trade. I can look up these statistics, but this is not something I would ordinarily pay any attention to. It doesn’t matter how little you lose on an individual trade, but how much you might lose on your whole portfolio. You’re not going to keep a ship afloat just by making sure the leaks are small. The important thing is to limit portfolio risk, the trades will take care of themselves.

We have devised a portfolio theory quite different from the classical theory that permits factors such as risk aversion, the nonlinear imbalances between profits and drawdowns, and long-term utility growth to be built in at the ground floor. They are all part of the formulas that define what it means for a system to be good. In this way, on even the most preliminary test run of a new idea we are forced to take into consideration the subtle and complex relations between drawdowns and long-term growth. At ETC we are dedicated utility maximizers and pay particular attention to the rate of expected utility growth.

It has been shown again and again, that without proper controls, even the most honest researcher will unconsciously bias research usually in a favorable direction. Trading systems research is especially rife with possibilities for this kind of wish fulfillment. During more than 20 years, we have seen an amazing variety of ways in which research can mislead or falsify. In response to this we have developed a veritable gauntlet of tests that any system must pass to be taken seriously. We test for post-dictiveness, for computer glitches, and for statistical artifacts. We test for overfitting, for maldistribution of returns, and the degree to which a system takes advantage of unusual and possibly nonrepeatable circumstances. Theses are just a few of the potential sources of trouble that we routinely monitor. This battery of tests can bring runaway enthusiasms back down to earth.

An important feature of our approach is that we work almost exclusively with price, past and current. One reason for this is that to make any progress in the early stages of quantitative investigation you usually have to reduce the relevant factors to one or two crucial variables. Price is definitely the variable traders live and die by, so it is the obvious candidate for investigation. The other reason is that in a system that’s making good use of price information, it is very difficult to add other information without degradation. Pure price systems are close enough to the North Pole that any departure tends to bring you farther south.

Many systematic traders spend the majority of their time searching for good places to initiate. It just seems to be part of human nature to focus on the most hopeful point of the trading cycle. Our research indicated that liquidations are vastly more important than initiations. If you initiate purely randomly, you do surprisingly well with a good liquidation criterion. In contract, random liquidations will kill the best system. At ETC we expend a lot of our research effort on liquidations.

Most standard statistical techniques are inappropriate for analyzing trading. Statisticians have developed many delicate techniques that squeeze information from minimal data, but these give false results in this business. I tell traders that if the results don’t sock you in the eye, they’re probably not real. Accordingly, we use only the most robust and assumption free statistical tests, We have an aversion to summary statistics that obliterate important structural elements. For assessing systems, we use a technique called bootstrapping so that the complete distribution of past outcomes can make itself felt in decisions; the distribution is not simply viewed in terms of its mean and variance which can give a distorted picture.

Our aversion to summary statistics that obliterate structure extends to the trading systems themselves. For instance, we avoid moving averages of price in making trades. Such moving averages are popular mostly because they’re mathematically tractable, but they smooth away all the structural information inherent in the price data.

Another popular tool, the price breakout, may be far better than the moving average, but it still eliminates most of the relevant structure. A breakout trader keeps two pieces of structural information, the high and the low for a given time period, but ignores all the price structure in between. For this and for other reasons we judiciously avoid breakout trading in all parts of all our systems.

It’s a lot easier to look scientific than to be scientific. We try to avoid the kind of delicate fine tuning that gives on the feeling of being very accurate, but that is in fact mostly arbitrary. We have taken to heart the research that shows that simple yes-no schemes, either fully accept or fully reject something, are more useful and more robust tan delicate weighting schemes. For instance, we do not favor trades according to how good they are supposed to be, instead we use the following rule: if a trade is good enough to make, it’s good enough to make at full size; if a trade isn’t good enough to make at full size, then don’t make it at all. We adhere to this kind of reasoning all the way down the line. All five systems we currently use are given equal weight. We also try to give equal weight to each of the fifty or so markets we trade.

I would characterize our overall approach as "conservative". This does not mean that we avoid market risk, for market risk is the raw material from which profit is fashioned, but we are conservative about what we know and about what can be done. My experience with Decision Theory indicates that knowing what it is you are ignorant of is in fact a powerful position to be in. The task of the trader is to locate those few areas where ignorance is not complete and to convert this information into profitability in an efficient way. False knowledge can be very detrimental to this process, but acknowledged ignorance can be quite beneficial.


I
 
perfect practice makes perfect:develop expertise and elite performance

Brett Steenbarger’s latest post on his blog:
http:traderfeed.blogspot.com/2006/06/lifes-formula-for-success-tribute-to.html


Quote:I recently completed a book in which I reviewed every piece of research I could find on the topic of human performance. I examined research with professional athletes, performing artists, surgeons, chess players, and traders. My studies took me from NASCAR racetracks and the development of world-class pit crews to the pits of the major world futures exchanges. One of the things I learned was something called the "Ten Year Rule". In a nutshell, the rule states that it takes at least ten years of sustained practice and effort to develop expertise and elite performance in any domain.

My research discovered that *how* this practice was structured was every bit as important as the duration of the practice. In other words, if practice did not offer the right amount of challenge--not too easy to become boring, not too difficult to become frustrating--and the right amount of feedback to permit learning and development, ten years of practice would simply amount to one year repeated ten times.

We say that "practice makes perfect", but that's not really true. Rather, "perfect practice makes perfect".

...

If there is one formula for success in life, it is this: to develop yourself, train. And to develop yourself to your fullest, train to failure. Maximum effort stimulates maximal growth.


Three pillars of expertise

By Brett Steenbarger


The number of traders who seek expert results is great; the number who are actually pursuing a developmental path toward expertise is relatively small.

A large body of research across various performance fields--from athletics to the performing arts--informs us of what it takes to achieve expert results. Until very recently, however, this research has gone unnoticed in the trading world. All too often, expertise is promised as the result of following a particular trading method, guru's advice, or self-help strategy. Rather, expertise is the result of several interwoven elements:

1) A developmental process - In every field that has been researched, sustained levels of expert performance have only occurred after there has been an ongoing process of skill acquisition. The well-known "ten year rule" suggests that most expert performers--musicians, athletes, chess players--require ten years of concentrated practice in order to master the knowledge and skills in their fields. Interestingly, however, the developmental process of the expert does not begin with such intensive effort. It begins with sheer fun and the discovery of a close match between the demands of a field and one's own talents, skills, and interests. Finding a performance niche--one in which performance becomes intrinsically emotionally rewarding--is necessary to sustain the effort needed for those ten years of learning.

2) Multiplier effects - The expert performer not only follows a different developmental process from the non-expert, but also follows a very different trajectory. The budding expert who finds a niche is often singled out by mentors for enriched learning experiences, which in turn create enhanced performance, and future opportunities. Normal learning follows a linear course; learning with multiplier effects is subject to compounding. Performance is neither all heredity, nor is it all environment. Instead, superior talents (heredity) help us select the experiences (environment) that will best maximize our performance.

3) Resilience - The odds that an expert performer will produce a successful outcome do not improve over the course of the expert's career, according to the research of Dean Keith Simonton. An expert batter is just as likely to strike out during his peak years as during his earlier career; an expert actress is as likely to produce a flop as a hit throughout her career. Highly accomplished individuals are distinguished by their sheer levels of productivity: they produce so many efforts that, eventually, some of them survive the process of natural selection and are enshrined as major achievements. A great trader may lose on many trades, but--with superior capitalization and risk management--stays in the game long enough to produce the large wins that make for a successful career. This requires an ability to tolerate losses and disappointment--a resilience that would lead many others to quit before ever reaching a pinnacle of productivity.

Are you on the path to expertise? A yes/no answer to each of the following questions might aid your frank self-assessment:

1) Do you have a structured process for identifying strengths and weaknesses in your trading and using these to continually improve your future trading performance?

2) Do you spend as much (or more) time working on your trading performance as you do in actual trading?

3) Does your trading make use of specific talents (lifelong abilities) and skills (acquired competencies) that have led to superior achievement in other areas of your life?

Simply writing in a journal or talking with a coach is no more a performance strategy for a trader than it is for an Olympic athlete. Yes, journals and coaches can be helpful in generating ideas, but performance ultimately hinges on the accelerated learning that comes from the multiplier effects of a concentrated developmental process. Think of a world-class athlete or concert violinist, and you'll have a sense for what it takes to develop expertise in trading--or any field of endeavor.


__________________________________________________________

Brett N. Steenbarger, Ph.D. is Associate Clinical Professor of Psychiatry and Behavioral Sciences at SUNY Upstate Medical University in Syracuse, NY and author of The Psychology of Trading (Wiley, 2003). As Director of Trader Development for Kingstree Trading, LLC in Chicago, he has mentored numerous professional traders and coordinated a training program for traders. An active trader of the stock indexes, Brett utilizes statistically-based pattern recognition for intraday trading. Brett does not offer commercial services to traders, but maintains an archive of articles and a trading blog at www.brettsteenbarger.com and a research blog. His forthcoming book (Fall, 2006), Enhancing Trader Performance, applies research-based ideas and techniques to the development of traders.
 
Last edited:
This is all good sense and a reality check for those who think they will master their art in five minutes.

For every thousand wannabes there are 999 also rans and many of these whinge and whine when things don't fall on a plate for them. Despite others determined efforts to help them they still complain because complaining is comforting in the attention it gains and it's easy to choose self pity over self responsibility. Basically, being a loser requires much less effort than being a winner.

The winners are the ones who get on with it, as Napolean Hill says, those with faith, intent and a burning desire to succeed at any cost.

There was a documentary recently questioning why the Asian students at specialist music schools (Yehudi Menuhin school) win the competitions and are the most successful, above their non Asian counterparts. The answer was simple. Application. The Asian kids physically put in several thousand more hours practise over the ten years than the others.

Wasn't it Einstein who said genius was 1% inspiration and 99% perspiration?
 
http://www.riskglossary.com

Definition
So what is this risk management? Risk management—or financial risk management, should we want to distinguish it from other uses of the word—can be defined as

Practices by which a firm optimizes the manner in which it takes financial risk.
 
Risk management is the reduction of risk not its elimination is basically - there are various companies that have devised risk charts to try and quantify how big a risk something is and mitigating factors but you can never truely eliminate risk...
 
I Wish I knew How it Would Feel to be Free

I wish I knew how it would feel to be free
I wish I could break all the chains holding me
I wish I could say all the things that I should say
say 'em loud, say 'em clear
for the whole round world to hear.

I wish I could share all the love that's in my heart
remove all the bars that keep us apart
I wish you could know what it means to be me
Then you'd see and agree
that every man should be free.

I wish I could give all I'm longing to give
I wish I could live like I'm longing to live
I wish that I could do all the things that I can do
though I'm way overdue I'd be starting anew. Well I wish I could be like a bird in the sky
how sweet it would be if I found I could fly
Oh I'd soar to the sun and look down at the sea
and I'd sing cos I'd know that
I'd know how it feels to be free
 
deliberate practice

What it Takes to Become an Expert

Scientists have conducted extensive research into what it takes to achieve mastery in a particular discipline. Karl Anders Ericsson and his colleagues studied top performers in a wide variety of fields and identified a specific type of practice, which they call deliberate practice, that is required to achieve excellence (Ericsson and Charness, 1994). Ericsson observes that deliberate practice can be identified by:

  • performance with full concentration, focused on generating improvement;
  • special exercises designed to improve performance;
  • graduated tasks, with easier skills being mastered before more difficult skills are attempted;
  • close guidance and timely, accurate feedback on performance.
Ericsson also found significant uniformity, across a wide range of fields, in the amount of deliberate practice required. To achieve excellence takes about ten years, and about four hours of practice a day. Whether you want to be an Olympic athlete, a research scientist or an expert trader, there is no substitute for hard work.
 
Top