Scalping

@DT: Yep, that's rebate trading there. I know, because I interviewed for a local prop firm that does exactly that and primarily uses BAC to make its money. They were one of those hit by the C reverse-split as well, lol. Weren't too happy about that.

The good news is that they'll only do it on stocks with a ton of shares outstanding (think billions) and trading at the lowest $ value possible. BAC just so happens to fit those criteria best so they're milking the **** out of it.
 
program trading has a huge impact on scalping something like the Emini. around 60% of the daily volume is automated trading. A huge portion is index arbitrage strategies so when you average retail scalper steps up with no regard to any likely buy/sell programs that may be in play it's no wonder they get shafted. These people would do well to monitor what the future/cash premium is and if they are on the side of the machines.
 
@DT: Yep, that's rebate trading there. I know, because I interviewed for a local prop firm that does exactly that and primarily uses BAC to make its money. They were one of those hit by the C reverse-split as well, lol. Weren't too happy about that.

The good news is that they'll only do it on stocks with a ton of shares outstanding (think billions) and trading at the lowest $ value possible. BAC just so happens to fit those criteria best so they're milking the **** out of it.


Cool - thanks for clarifying. C was about $5 when they rebate traders were feeding off it.

BAC is almost $10 - so they need a lot more margin for it. It's also got more of a range so I reckon this is hurting too. No doubt BAC will do a reverse split at some point because this does not help their share prices and senior management gets paid partly in shares.

Get it up to $40 a share and the rebate trading is going to need a lot of margin and they'll have to move on.

It amazes me that they actually get paid a rebate for this. This is liquidity provision just for the sake of it. It does not halp to facilitate trade. At the end of the day, any trader on that exchange is paying for this. Their trade fees are helping to pay these totally pointless rebates.
 
program trading has a huge impact on scalping something like the Emini. around 60% of the daily volume is automated trading. A huge portion is index arbitrage strategies so when you average retail scalper steps up with no regard to any likely buy/sell programs that may be in play it's no wonder they get shafted. These people would do well to monitor what the future/cash premium is and if they are on the side of the machines.

Well - whilst I do believe that 60% is automated, that does not mean HFT and it does not mean the 60% is spread out equally.

on BAC, I'd say almost 100% is HFT rebate trading.

Automation itself covers a lot of sins. I have my platform put on automated OCOs and I can get it to trail if I want. This is automation.

I have friends who trade stocks and will set their platform to buy @ VWAP or TWAP in the days coming up to an earnings announcement.

As you mention - arb opportunities between cash & futures MUST be automated. Still - none of this necessarily stands in the way of a scalper. What would stand in the way of a scalper was if someone automated his particular way of trading but I don't see evidence that all scalping methods are obsoleted through automation, especially as there is a lot of discretion involved in scalping techniques.
 
Well - whilst I do believe that 60% is automated, that does not mean HFT and it does not mean the 60% is spread out equally.

I'm not aware of any concrete figures either regarding HFT volume.
There are estimates from 2010 of pure HFT volume:
55% Equities
40% Futures
25% FX
20% Options
10% Fixed income
http://www.conatum.com/presscites/HFTMMI.pdf

DxWer.gif

Nanex ~ The Rise of the HFT Machines
The increase from 2010 onwards can be seen above as well as the overall
increase since 2007.

What would stand in the way of a scalper was if someone automated his particular way of trading but I don't see evidence that all scalping methods are obsoleted through automation, especially as there is a lot of discretion involved in scalping techniques.

No there is no evidence.
About the only sensible conclusion you can draw is that HFT
has had an effect on scalping, whether thats positive or negative would
depend entirely on the style - primarily duration and target size.
 
Isn't this a concealed head and shoulder pattern? I don't understand how it should be impossible to trade, if that is the point being made.

BAC.png


Looks to be two places where you could try to scalp here. 1. when you first notice it at 13:30 2. Or the pullback around 14:30.
 
I find this very interesting DT. Obviously the question of HFT will rumble on for some time, but meanwhile what can we do?

Assume that chart is total bullsh1t, full of trades that basically shouldn’t have happened. Nonetheless, all I see is a great chart that threw up several excellent trades just using very basic price action. This to me looks like an extraordinarily easy day to trade - the price action is exceptionally smooth and regular. I have a suspicion that whatever effect HFT has (and I personally think overall it is small, although that’s just my opinion and may well be wrong), it is likely to be at worst neutral and at best beneficial for retail punters.

Anyway, the chart (see attachment at bottom below quoted chart). I’m sure this will all be old hat to you and I know you’re not a big chart fan, but newer traders reading this thread might find it useful.

The day opened very strongly and after a little initial hesitation moved up hard in what I would describe as effectively a spike – the slope of the trend line (first green line) suggests unsustainable behaviour to me. I would be looking for a pullback to get in long.

When the pullback came, it was in the form of a bear spike. I would not be looking to sell on the first bearish action after such a strong bull spike, but the strength of the bear spike would make me wary of buying also. The bear spike was getting stronger and more urgent as it progressed, and this again would make me think it was unsustainable. Whenever I see this I always think whether we are looking at a vacuum as buyers step aside rather than genuine heavy selling. We then got a miniature double bottom and a strong bull reversal bar (inside the blue rectangle) and this coupled with the earlier solid bull strength makes for a good spike / pullback continuation above the large bullish bar (you could think of it as a reversal as well of course of the small bear trend, but to me this is a with-trend continuation trade – not that it really matters what label you put on it). There is a good chance that such a strong bull move won't fail on the first attempt, and it is reasonable to expect some kind of test of the extreme. One thing I would note at this stage is that bears have now put in a strong showing (albeit an unsuccessful one for now).

So that’s one good and I think very obvious trade.

Price then resumes up in a tight channel – an opening trend resumption. I would note that the slope of the trend line (second green line) this time is much shallower than the first one. The bullish pressure in the market might be weakening. This channel ends in a double top with the previous high. Price strongly rejects this area for a second time. Context is all important - the first time I would be thinking absence of buyers, but the second time we get a strong reaction one starts to think in terms of the presence of sellers.

It then moves up in a bullish channel, which I would now be wondering about, as it might be a bear flag. I would note that the new trend line is shallower still (third green line), and I would now be seriously thinking in terms of a transition to a trading range at least or even possible reversal of the day’s trend thus far.

There is a reasonable break out below the channel and this would be a reasonable if aggressive entry based on the prior and mounting bear strength. I personally would not have taken it, but I think nonetheless it is a perfectly sound entry. Note that after the test of the bullish extreme, we have now seen a lower high.

Price then settles into its middle of the day doldrums with a tight trading range, which naturally makes one think “breakout mode”. We get a reasonable bear breakout (just on the edge of the first green box) and I think selling below that bear bar would be reasonable, albeit too aggressive for me. However, we immediately get a weak bull reversal bar with a “pin bar” shape. I love pin bars because they are so often great fade set ups (LOL), and this I think would be a very solid entry below it (sell below first blue line). Obviously, there are going to be new sellers below, and there are also going to be disappointed longs who are going to get out once price breaks down.

So I would say this is the second very solid (but perhaps not so obvious for new punters) trade of the day.

We get a strong bearish bar followed by a strong bullish bar (first green box). I would not be looking to go long at this stage, although some might given the double bottom with the earlier pullback (blue box from early in the day); a long wouldn’t have triggered however. I might have had a sell under the bullish bar, reasoning as above that we would have all sorts of sell orders under there.

I would say that was the third very sound trade of the day.

Now it gets very easy. The bull reversal peters out and price breaks down strongly once again. You could have sold the breakout of the bear flag (although I wouldn’t). Bulls step in once again with a reasonably strong showing (second green box). This is the second attempt to reverse the mounting bearishness and if this one fails (so quickly after the previous attempt failed) it is likely that we will see a good move down as bulls will likely step aside for lower prices. There could easily be a lot of bulls trapped here.

The fourth trade (and the trade of the day) was a sell under that bullish bar (second green box, sell under the third blue line), because you are going to have a lot of trapped bulls forced out at that stage. Sure enough, price breaks out strong and plummets. Note as well this is a break of a triple bottom, which is a solid place to look to sell. Bulls have very likely lost the day, and many will step aside until we’ve had a good move down.

The market looks strongly like it has flipped to bearish now, and the little pause (blue circle) looks to me like a great place to push your shorts. Again, there are early bulls in that area who are likely to be disappointed and will sell below the big bearish bar with lower tail on the right hand edge of the circle. Personally in situations like this I sell below the bear inside doji, but a more cautious trader could wait for the downside break of the big bearish bar. Bulls from earlier in the day who need to finish flat will be bailing now, adding to the selling pressure as we move towards the close (one of the reasons why days like this - strong one way, but no follow through and then reverse) can be so profitable as you get the late stampede for the exits).

So I make that 5 very sound trades just using very basic price action on one chart, thinking about the market context and crucially considering where orders are likely to be (particularly those exit orders placed by trapped traders). I’m sure a competent person could find more to do using the ladder, although I personally don't find it useful for some of the reasons already discussed (but mostly because it gives me too much to process and ends up being a distraction for me). I’m not saying I’d have taken all of them, but even just hitting the daisy (trade 4, final bull capitulation) would give you an awesome day.

As I say, this is just very basic analysis. As I’m sure you know, there is a lot more on this chart, but I just wanted to highlight some of the most obvious points that even a fairly new trader could, with some thought and a little experience, easily pick out and trade in real time. The key here is to continually consider the market context, most particularly the true trend. Many inexperienced traders would think we were still in bullish mode, but the bigger picture combined with a few small examples of price action (namely the repeated failure of apparently solid-looking bull moves) showed the true developing trend long before it was fairly under way. Then it's just a matter of fading the weak counter-trend moves (that weak hands would mistakenly view as with-trend or resumption moves).

The way I manage things it would be:

Trade 1 – scratch.

Trade 2 – Profit.

Trade 3 – Profit and pretty easy management.

Trade 4 – Profit and very easy management.

Trade 5 – Profit and very easy management.

The main point is, all this action may be crap generated by HFT firms, but who cares? They created a very easy – and profitable – day to trade.


I had a look at the volume on stocks yesterday.

It used to be that C was getting seriously hit by HFTs. They moved away when C did a reverse split.

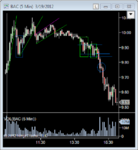
Looking at the markets, it seems that BAC is volume leader:

BAC.png


680 million shares traded and a 50c range. One of those 5 min bars had 17M traded and a 12c range. It's certainly not the same as C was a few years ago but this looks like algo rebate trading to me. It's not mean revision and it's certainly not directional. If I'm paying for these monkeys to get rebates on those trades, I'm not happy... :)
 

Attachments

  • BAC.png
    BAC.png
    68.8 KB · Views: 213
Last edited:
I find this very interesting DT. Obviously the question of HFT will rumble on for some time, but meanwhile what can we do?

Assume that chart is total bullsh1t, full of trades that basically shouldn’t have happened. Nonetheless, all I see is a great chart that threw up several excellent trades just using very basic price action. This to me looks like an extraordinarily easy day to trade - the price action is exceptionally smooth and regular. I have a suspicion that whatever effect HFT has (and I personally think overall it is small, although that’s just my opinion and may well be wrong), it is likely to be at worst neutral and at best beneficial for retail punters.

Anyway, the chart (see attachment at bottom below quoted chart). I’m sure this will all be old hat to you and I know you’re not a big chart fan, but newer traders reading this thread might find it useful.

The day opened very strongly and after a little initial hesitation moved up hard in what I would describe as effectively a spike – the slope of the trend line (first green line) suggests unsustainable behaviour to me. I would be looking for a pullback to get in long.

When the pullback came, it was in the form of a bear spike. I would not be looking to sell on the first bearish action after such a strong bull spike, but the strength of the bear spike would make me wary of buying also. The bear spike was getting stronger and more urgent as it progressed, and this again would make me think it was unsustainable. Whenever I see this I always think whether we are looking at a vacuum as buyers step aside rather than genuine heavy selling. We then got a miniature double bottom and a strong bull reversal bar (inside the blue rectangle) and this coupled with the earlier solid bull strength makes for a good spike / pullback continuation above the large bullish bar (you could think of it as a reversal as well of course of the small bear trend, but to me this is a with-trend continuation trade – not that it really matters what label you put on it). There is a good chance that such a strong bull move won't fail on the first attempt, and it is reasonable to expect some kind of test of the extreme. One thing I would note at this stage is that bears have now put in a strong showing (albeit an unsuccessful one for now).

So that’s one good and I think very obvious trade.

Price then resumes up in a tight channel – an opening trend resumption. I would note that the slope of the trend line (second green line) this time is much shallower than the first one. The bullish pressure in the market might be weakening. This channel ends in a double top with the previous high. Price strongly rejects this area for a second time. Context is all important - the first time I would be thinking absence of buyers, but the second time we get a strong reaction one starts to think in terms of the presence of sellers.

It then moves up in a bullish channel, which I would now be wondering about, as it might be a bear flag. I would note that the new trend line is shallower still (third green line), and I would now be seriously thinking in terms of a transition to a trading range at least or even possible reversal of the day’s trend thus far.

There is a reasonable break out below the channel and this would be a reasonable if aggressive entry based on the prior and mounting bear strength. I personally would not have taken it, but I think nonetheless it is a perfectly sound entry. Note that after the test of the bullish extreme, we have now seen a lower high.

Price then settles into its middle of the day doldrums with a tight trading range, which naturally makes one think “breakout mode”. We get a reasonable bear breakout (just on the edge of the first green box) and I think selling below that bear bar would be reasonable, albeit too aggressive for me. However, we immediately get a weak bull reversal bar with a “pin bar” shape. I love pin bars because they are so often great fade set ups (LOL), and this I think would be a very solid entry below it (sell below first blue line). Obviously, there are going to be new sellers below, and there are also going to be disappointed longs who are going to get out once price breaks down.

So I would say this is the second very solid (but perhaps not so obvious for new punters) trade of the day.

We get a strong bearish bar followed by a strong bullish bar (first green box). I would not be looking to go long at this stage, although some might given the double bottom with the earlier pullback (blue box from early in the day); a long wouldn’t have triggered however. I might have had a sell under the bullish bar, reasoning as above that we would have all sorts of sell orders under there.

I would say that was the third very sound trade of the day.

Now it gets very easy. The bull reversal peters out and price breaks down strongly once again. You could have sold the breakout of the bear flag (although I wouldn’t). Bulls step in once again with a reasonably strong showing (second green box). This is the second attempt to reverse the mounting bearishness and if this one fails (so quickly after the previous attempt failed) it is likely that we will see a good move down as bulls will likely step aside for lower prices. There could easily be a lot of bulls trapped here.

The fourth trade (and the trade of the day) was a sell under that bullish bar (second green box, sell under the third blue line), because you are going to have a lot of trapped bulls forced out at that stage. Sure enough, price breaks out strong and plummets. Note as well this is a break of a triple bottom, which is a solid place to look to sell. Bulls have very likely lost the day, and many will step aside until we’ve had a good move down.

The market looks strongly like it has flipped to bearish now, and the little pause (blue circle) looks to me like a great place to push your shorts. Again, there are early bulls in that area who are likely to be disappointed and will sell below the big bearish bar with lower tail on the right hand edge of the circle. Personally in situations like this I sell below the bear inside doji, but a more cautious trader could wait for the downside break of the big bearish bar. Bulls from earlier in the day who need to finish flat will be bailing now, adding to the selling pressure as we move towards the close (one of the reasons why days like this - strong one way, but no follow through and then reverse) can be so profitable as you get the late stampede for the exits).

So I make that 5 very sound trades just using very basic price action on one chart, thinking about the market context and crucially considering where orders are likely to be (particularly those exit orders placed by trapped traders). I’m sure a competent person could find more to do using the ladder, although I personally don't find it useful for some of the reasons already discussed (but mostly because it gives me too much to process and ends up being a distraction for me). I’m not saying I’d have taken all of them, but even just hitting the daisy (trade 4, final bull capitulation) would give you an awesome day.

As I say, this is just very basic analysis. As I’m sure you know, there is a lot more on this chart, but I just wanted to highlight some of the most obvious points that even a fairly new trader could, with some thought and a little experience, easily pick out and trade in real time. The key here is to continually consider the market context, most particularly the true trend. Many inexperienced traders would think we were still in bullish mode, but the bigger picture combined with a few small examples of price action (namely the repeated failure of apparently solid-looking bull moves) showed the true developing trend long before it was fairly under way. Then it's just a matter of fading the weak counter-trend moves (that weak hands would mistakenly view as with-trend or resumption moves).

The way I manage things it would be:

Trade 1 – scratch.

Trade 2 – Profit.

Trade 3 – Profit and pretty easy management.

Trade 4 – Profit and very easy management.

Trade 5 – Profit and very easy management.

The main point is, all this action may be crap generated by HFT firms, but who cares? They created a very easy – and profitable – day to trade.

Good one. :clap:
 
So I got a message from someone asking about set ups that I use. I annotated a couple of footprint charts for him of two trades I took a couple of hours ago in the bobl and I might as well post them in this thread to give some people an idea of why you need to be watching the DOM and T&S if you are scalping. Sure you could have taken the trades with only a bar chart but I doubt you would have had much conviction in them. Maybe the first one but not the second.

Before everyone jumps on me saying I watch charts, I wasn't looking at the first chart when I made the trade I was watching the DOM and T&S very intently and only use it for illustrative purposes. I caught the second trade by seeing the volume profile on the footprint chart and the print at 01:21 at .53, at which point I switched to watching the DOM and T&S. I would also add that you would not have needed the footprint charts at all to make either trade, I just have a poor memory.

The first trade was the high of the day so far and good for quite a number of ticks, the second one didn't give much but some times you catch it before a bigger move. I can't really illustrate the full dynamics of the trade because I don't have a recording of the DOM so you can't see what was going on in the book at the time, but at least you can get an idea of what was happening to the prints. The first chart is formatted as (bid volume x ask volume) and the second one is total volume with footprint shading.


Anyways the market was dead when I started writing this up and it has since rallied and I missed a couple good set ups.

So, YOUR WELCOME :p
 
Guys - it's lovely you are analysing that chart & all...

But I did only post it to show the amount of volume and relatively low range for the volume.

I didn't say it was untradeable, just that I thought this was rebate trading. Totally fkn pointless to give these guys a rebate for 2 million shares a minute on this thing...

Still - wouldn't want to get in on a limit order.
 
So I got a message from someone asking about set ups that I use. I annotated a couple of footprint charts for him of two trades I took a couple of hours ago in the bobl and I might as well post them in this thread to give some people an idea of why you need to be watching the DOM and T&S if you are scalping. Sure you could have taken the trades with only a bar chart but I doubt you would have had much conviction in them. Maybe the first one but not the second.

Before everyone jumps on me saying I watch charts, I wasn't looking at the first chart when I made the trade I was watching the DOM and T&S very intently and only use it for illustrative purposes. I caught the second trade by seeing the volume profile on the footprint chart and the print at 01:21 at .53, at which point I switched to watching the DOM and T&S. I would also add that you would not have needed the footprint charts at all to make either trade, I just have a poor memory.

The first trade was the high of the day so far and good for quite a number of ticks, the second one didn't give much but some times you catch it before a bigger move. I can't really illustrate the full dynamics of the trade because I don't have a recording of the DOM so you can't see what was going on in the book at the time, but at least you can get an idea of what was happening to the prints. The first chart is formatted as (bid volume x ask volume) and the second one is total volume with footprint shading.


Anyways the market was dead when I started writing this up and it has since rallied and I missed a couple good set ups.

So, YOUR WELCOME :p

Good post, as far as manual exec, locals and scalping goes, fixed income is the place to be. Very low HFT action. Something I don't see changing anytime soon, if the HFT mobs could hit that market, they would have by now.
 
I have a suspicion that whatever effect HFT has (and I personally think overall it is small, although that’s just my opinion and may well be wrong), it is likely to be at worst neutral and at best beneficial for retail punters.

The main point is, all this action may be crap generated by HFT firms, but who cares? They created a very easy – and profitable – day to trade.

Perfectly valid point, that method is largely unaffected by HFT, and quite possibly benefits from it.
I never have subscribed to the school of thought that says one methodology is better than another.
For me it boils down to how well the methodology is executed, not the individual merits of one style versus another.
 
Last edited:
I presume this is because your average HTF would go into standby waiting for something to happen on the treasuries...
 
I presume this is because your average HTF would go into standby waiting for something to happen on the treasuries...

Yeah maybe, personally I think its simply a case of rich pickings elsewhere so why
focus on a market where they have no bent edge :)
 
What do you guys think of scalping with EUR/CHF? I mean should we expect an intervention from SNB?
 
BAC is almost $10 - so they need a lot more margin for it. At the end of the day, any trader on that exchange is paying for this. Their trade fees are helping to pay these totally pointless rebates.

bumpety bump.

'They need more margin for it' - trust me margin is NOT a problem, you can get 40:1 BP right of the bat. So deposit $10,000 and you can trade 50,000 shares a pop. If you have a track record 100:1 BP on BAC will probably not be a problem. I have 33:1 on my account. the last worry you have is margin lol.

'Their trade fees are helping to pay these totally pointless rebates' - with so many liquidity monkey's round it's no wonder they get run over. The rebates thing is really a consequence of how the US stock market developed with various ECN's paying rebates to attract business then the inverse ECN model came in. The beauty of the ECN 'system' is that it can provide clues as to micro movements, the cheaper routes tend to clear 1st. You can also see the the larger traders (10,000 shares plus+ lots) pop off trades, its one big ECN rebate kickback override mess.

The beauty of trading something like BAC is that the fees are so much more advantageous.

compare the numbers for capture the spread (1c on BAC, 1 tick on ES)

ES = $12.50 tick
BAC = $10 (for 1c spread on a 1000 lot)

Commission c. $3 for the ES so you net $7. (correct me if I am wrong on this commission I dont trade the ES)

Commission on 1000 shares = 20c (if you know where to look)
other misc costs 8c

ECN rebate = $2.50 per 1000 shares

so basically you net out $7 for capturing the spread on ES and you can net out $14.72 for 1000 shares across the 1c spread on BAC.

The fees as a % of the spread capture are way way lower, hence much easier to scalp.

that's enough cats out of the bag for now.:D

nighty night.
 
Hi All
I'm based in Great Britain and have been useing the following scalping method
on intertrader advanced charts
on gbp/usd eur/usd dax mornings gbp/usd eur/usd wall st afternoons
MACD 5 8 9
PSAR 0.1 0.11
Bollinger bands
pivot lines
On 5 minute charts
Open a trade sell on first red or buy on first green psar
I quickly look at 1 minute for confirmation and 15 minutes for general trend
I place the trailing stop at psar which is usually 8 to 15 pips away from start of trade
70% profit is taken at 5 pips and rest when trade is stopped out either by loss or profit
Last week i took 150 pips trading part time.
Feel free to papertrade if in doubt and any feedback welcome
 
What do you guys think of scalping with EUR/CHF? I mean should we expect an intervention from SNB?

Last month their EUR reserves declined so at least for now I think they will keep 1.20 level intact. This week they also opened office in Singapore to do more diversification and keep an eye on CHF.
 
Top