resistance level

money123

Member
Messages
78
Likes
3
hello people

would one of you very nice ppl please help me out on this issue -
whenever i buy a stock it tends to be at a price when everyone seems to be selling.
i have gathered from posts that i need to be using resistance levels[i think].
what are res levels? how do they work? are they suitable for swing trading? and lastly does anyone have any recs for books that would help and prepare me for swing trading.

ps. very informative and helpful site!
there seem to be a lot of experienced traders helping novices
such as myself.
 
Hi Money 123,

Pull up any chart you like, any time frame and look at areas of congestion. ie where the price has trouble either carrying on up and through or down and through. These are your sup and res areas.

Broadly speaking. One way to trade it is if a price has hit resistance, you short it with a stop the other side of the resistance area.

Reverse this if you think the price will carry on through.

How can you tell what it is going to do without qustion?

Well, wouldn't we all be rich if we knew that.

If your charting software draws Fibs you have it all worked out for you.

There are also small programs that work out sup and res for you.

good luck.

Options.
 
thank you for your reply options.
do you recommend any charting software and what are fibs.
and lastly i would appreciate it if you or anybody else could give me an example of how i would get bt groups[bt.a] sup and res levels.
any tips on bt are also welcome
 
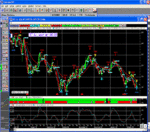
Support and resistance on BT? see attached chart.. where price turns up/down shows clear support/resistance...
 
sorry .. forgot chart..

Looking at it: at a support level.. either rally or collapse from here...
 

Attachments

  • bt.gif
    bt.gif
    154.8 KB · Views: 568
Resistance and support levels are also often found at the 00s - ie, the rounded number levels, such as 100p, 600p, etc. In the case of BT, in Madasafish's example above, these are at 200p - if you draw a horizontal line at the 200p mark you will see the price bounces off it and then when it drops through it, it rises again and hits its head on it.

Any rounded number, or easy-to-remember number usually is a support and resistance area as buyers/sellers historically remember these prices. They are also the buying and selling points of institutions.

In the case of BT, the 150p level works well too.
 
Ta for the chart Mad, and thanks for expanding further Skimmy.

Money123, would I reccomend a charting package? No, I wouldn't.
It's a rather personal thing really, a bit like some people drive Ford motor cars because they like them and other people hate them and will only drive Nissans, yet they both do the same thing.
Madasafish I know uses Linnsoft and Skim (and myself) use Sierra. Though I should think most people have tried various packages. I use Sierra simply because they work off a price feed from interactive brokers who I trade with, and are real time. They aren't the best charts in the world, yet they are reasonably priced and they improve them with each build that comes out. The best charts I have used so far have been from Market Eye, but they are expensive. It depends on what you want to do. If you want to sit in front of a screen(s) all day and trade live where a delay in the feed of 2 secs can cost you £50, then you need real time. If you are going to swing or trade over a longer time period then end of day may be more suitable (and cheaper.)

I can tell you what packages to avoid though. All those that are predictive and give trading signals. You will need deep pockets to suffer any drawdowns. Course you may get one that works, but then we would all have it. And we can't all be right all of the time. Otherwise we wouldn't have a market.

Fibs? Sorry, it's short for Fibonnaci, a maths geezer who worked with numbers. I won't go into it here, (too long and complex. Try a search on google.) But fib lines have an uncanny knack of calling the sup and res lines right. Mind you, if you put a grid over a Chart, you can see where congestion is building up for yourself.
Fib lines are projected into the future part of a chart, so you can see where the price 'may' turn.

Back to charts. Lycos do 'live' charts of the Nasdaq and the usa indices, but bear in mind that if you trade these you will be going up against people like 'Naz' (for stocks) who use level 2 screens to give added insight into what's happening and in effect you will be trading with one eye shut..

There are quite a few decent sites around for eod data. www.inverline.com is one. You can practise trading of sup and res using these.

Sometimes it is better to wait until a price has broken (or not) the sup and res and then trade it.

Good luck.

Options.
 
Money123:

Regarding your question about software recommendation, are you thinking of swingtrading a) intraday or b) end of day (EOD)?

Knowing this might help with further software suggestions.
 
erm..... i think i need both as i wanna swingtrade holding a stock for
a couple of hours to a couple of weeks - selling as soon as ive made a little profit about 3%.

thank you for your help everybody.
 
money123 said:
erm..... i think i need both as i wanna swingtrade holding a stock for
a couple of hours to a couple of weeks - selling as soon as ive made a little profit about 3%.

thank you for your help everybody.

How far are you going to let it go in the hole before you cut the position?
 
Top