Renko trading

Jason101

Experienced member
Messages
1,376
Likes
218
Hi,

I am trying to get a greater understanding of Renko Charts.
I have two questions about concepts I am not quiet getting at the moment.

The first question arose on stop placement. Please see the attached graph to help with the explanation.

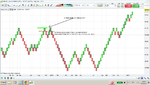
Each Renko bar is set at 100 ticks. If I wanted to enter after the formation of the bar closing at 16,200 and place a 100 tick mental stop, then logic would say that the stop needs to be placed at 16,100 ticks, which is at the bottom of this bar.
But if I had a mental stop here I would not know where price was going to close until the next bar is printed, in this case at 16,000 pips which is 200 pips passed my entry, double my intended stop.

How would I implement a 100 pip mental stop on this chart?
Thanks

EDIT: ON GRAPH SHOULD HAVE WRITTEN ENTRY ON CLOSE OF THIS BAR, NOT ON BREAK OUT.
 

Attachments

  • RENKO STOPS.png
    RENKO STOPS.png
    95.9 KB · Views: 1,213
Last edited:
BSD, that is so.

CV, This is true too, they are called Median/Mean Renko Charts, available on an MT4 indy.
As well as wicks the bricks overlap each other.

Does anyone have any answers to my stop query?
 
Last edited:
I had thirsty night out yesterday so take this with the proper caution, but I'd say I'm in the 200 pip camp for positioning your stop loss.

The new bar will only form once it's gone 100 pips north of the high of the old one, the low of the old one where you want to put your stop loss is a hundred pips below the low of the new one, so 100 + 100 = 200 pips.
 
Ah, me too, I seem to be thirsty most nights!

So if this is true, then the only way to implement a 100 pip stop would be to change to 50 pips bricks?
This is so confusing after looking at candle sticks for so long.
 
Haha thirst is good.

Or wassat greed lol.

But yeah, if you want a 100 pip stop go to a 50 pip renko.

Or stick with the 200 pip stop off of 100 pip renkos and trade a smaller position size.
 
Are good in theory, but what I was really after was trading Percentage bricks i.e. sized on ATR (14 is Renko default). I suppose I could default the Daily ATR renko chart then halve it and trade that?

Maybe Timsk will come along with some advice, I think he purely trades Renko Charts?
 
Last edited:
. . . Maybe Timsk will come along with some advice . . .
Hello.
:cheesy:

Jason - in answer to your initial question "How would I implement a 100 pip mental stop on this chart?", the answer is you can't! At least, that is to say you can't and enter/exit according to the way the Renko prints. If you go long at 16,200, a red brick will only print if price drops a full 200 points to 16,000 or lower. So, theoretically, you could have a stop at 16,001 (i.e. 199 points below your entry), price could hit it, take out your stop and then resume its way north again. If it hits 16,300, then another green brick will print and the chart will never show a red brick and how price went against you. As c_v rightly says, top notch charting packages show Renko with wicks - which can be useful.

The problem you highlight is one of the drawbacks to using Renko. One solution is to reduce your brick size down to 50 (or even smaller). This will enable you to finesse your entry and have a tighter stop. Personally, I'd allow for the spread as well, and be sure that the prices traded are the same data as the chart. I don't trade forex so I can't say for sure but, for example, if you trade indices with IG and get the free ProRealTime Renko charts - they are different. So, the charts plot according to exchange data, whereas the prices you trade are IG's own and are not the same. Unfortunately, this reaps absolute havoc with Renko charts!
HTH.
Tim.
 
Last edited:
Hi Tim, Thanks for taking the time.

So, if the last brick was long, then the next long brick will have a value of 100 and print from the close price of the previous brick. Where as if the next brick is a short, it will also have a value of 100 pips, but it will start printing only when price is 100 pips away from the last printed price and complete when it is a further 100 pips away from its opening price.

So you will be alerted to a move in the same direction at 100 intervals and you will be alerted to a reversal at 200 intervals?

So to trade a 1:1 R/R for 100 pips you would have to drop down to a 50 Renko brick size. Then when trading in the direction of the last brick you would

1. Exit for loss after 1 brick print (i.e. 100 pips)
2. Exit for profit after 2 brick prints (i.e. 100 pips)

It seems confusing to have a chart with bricks set at a number and have a brick print of the same brick represent two completely different values depending on its direction in relation to the last brick.

So in trade management you would need to constantly think in multiples of risk to calibrate your on going R:R. I could only see this being useful if you were trading a turtle style trade management system, with the initial risk of 2 risk to 1 reward (probably not so good for FX.)

So once in a trade if I let price go against me by two Renko bricks, in effect I am looking at a 300 stop loss (if each brick is 100). The initial reversal brick finishes printing after 200, then the next brick, will be worth 100, as a continuation of the prior brick?

So if I have grasped this correctly, 100 pips for a continuation brick, 200 pips for a reversal brick. Then a Renko chart is biased visually to show that price has a steeper trending curve than it actually does?

Sorry for the long post, I just cant quite believe these charts are so strangely arranged!

EDIT: (Yes I am on ProRealTime Renko charts)
 
Last edited:
. . . So if I have grasped this correctly, 100 pips for a continuation brick, 200 pips for a reversal brick. Then a Renko chart is biased visually to show that price has a steeper trending curve than it actually does?
Hi Jason,
As far as I can tell, your understanding of Renko is correct. I would phrase the sentence highlighted in blue slightly differently to say . . .
Renko, like Point & Figure, is weighted in favour of the prevailing trend (i.e. whatever the last printed brick is) and designed to filter out noise to reveal the main dynamics of the market.

I don't quite agree that 'price has a steeper trending curve than it actually does' in that the chart is true to itself. Yes, it may well look that way if you compare it to a candlestick chart, but that's comparing chalk and cheese as the candlestick chart will show you all the 'noise'.

If you're struggling to work out how best to use Renko charts (if at all), may I suggest you just use them for what they're really good at, namely, displaying the main trends and highlighting key areas of S&R. You can then use another charting method (or whatever you fancy) for the specifics of trade entry, stop placement and exits. Just a thought?

Cheers,
Tim.
 
Last edited:
Hi Jason. I use Metatrader for my trading, Renko for my charting, so this may, or may not, be of interest to you.
I use 'normal' Renko blocks...not the new 'mean' version. And no tails.
Each block is 10 pips, & I use an EA to close out the trade AT A CASH PROFIT . not a pip one.
My EA is set at £40.0
I use the 'Sweetspotsgold' indicator set at 100 sub level.
And (On the Renko chart) an ma cross over alert, one set at 1, & the other at 2 sma. This gives me an audible alert when Renko has turned by two blocks.
If the move should develope past my £40, I will re-enter 1 block/or one sweetspot sub level below my exit.
I'm retired now, & the above gives me a steady £6-800 per month to play with.
I trade forex CFD's & for a £0.10 stake I win/lose £1.0. The Margin required is £38.00.
Very comfortable trading, no nail biting.
 
. . . Very comfortable trading, no nail biting.
Hi Daytide,
Interesting approach - any chance of a chart to illustrate it please? A picture paints a thousands words etc.
Thanks,
Tim.
 
Hi Daytide,
Interesting approach - any chance of a chart to illustrate it please? A picture paints a thousands words etc.
Thanks,
Tim.
Of course :-
Here go.
 

Attachments

  • EURUSDM1.png
    EURUSDM1.png
    50.5 KB · Views: 333
  • EURUSDM2.png
    EURUSDM2.png
    60.6 KB · Views: 360
Top