Reliability of End Of Day Prices?

daveylibra

Junior member
Messages
23
Likes
0
Hi, I am quite new to spread betting shares, and I like to review my positions after end of day. I assume this is what a lot of other people do.

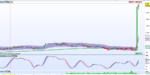
But I find it confusing that the CLOSE price of a share can be quoted a different wherever you look. You can even have a position with IG, be in loss, but on the linked ProRealTime chart, be in profit.

Check any share, the Google price, Yahoo price, LSE website price will be different.
(Yes I am taking into account bid/ask spread.)

And if we are analysing "price action" on candlestick charts, this can often be skewed because of this.

I was on IG's live chat and was told that when markets are closed different price feeds are used, when they are open, it shouldn't be an issue. Why not use the same price feeds all the time? And when using EOD data, it is an issue.

Anyone think the same?
Regards
Dave
 
Yes, they do vary a tiny bit - but surely not enough to break a pattern or a view of price action?

Its a little disconcerting, charts do vary depending on the source, but I feel this just echoes the fact that we're not engaged in a field of science here.
 
Thanks for the reply...

I think that the larger the spread of a share, the greater the EOD price variance can be.
And I think it can change a view of price action, if we are trying to use set rules to determine whether to close or reverse a trade.
As for IG and ProRealTime, if they use the same data feed when markets are open, why not when closed? I mean, it must suddenly switch at close of day, which seems quite pointless?
 
I missed the chance to say that IG and other SB companies are quoting and displaying not the actual prices of the underlying share but the buy/sell prices for their market based on this share. This may easily be a fraction of a percentage difference.

Also, some SB firms display charts based on the mid-price of their spread, others use their quoted bid price. Again, both can vary a tiny bit from the underlying.

Then again from what I recall from when I had Level 2 access was that the stock market "price" of a share was displayed as a bid/ask quote, the figures displayed being those at which the most recent orders were filled. But below them on-screen would be a whole raft of bid-ask prices for varying numbers of shares, all different. So there's no precise answer to the simple question, what price is/was this share?
 
I see what you mean. The price is only what someone is willing to buy at or sell at.
But I will try to screenshot at least one later to illustrate a very large variance.
 
different feeds can display different prices often depends on the speed of the feed or the liquidity pool of the broker, some traders seek out these differences and seek to profit from them with latency arbitrage
 
Just to add to this thread that the share I was looking at in particular was AcellorMittal.
You know what happened? Yesterday it rose 200% in 1 day. Never seen a chart like it before.
Anyone else noticed it? If so does anyone know anything avout the reasons why. Not much in the news for that day.
 
AccelorMittal chart

peaked 3 days after earnings release.
 

Attachments

  • amittal.PNG
    amittal.PNG
    58.5 KB · Views: 306
Top