Hello. I want to give this system out to anyone willing to put the time, effort and patience that it needs. This is a great system that anyone can learn. I recommend paper trading it for one month and also to keep a journal of trades and take before and after screen shots.
This system is fractal meaning it works on all times frames. I use the 15 min chart for intraday trades. 1hr chart for maybe a day or 2, and then the 4hr chart for longer term trades 2-6 days. Notice each time frame is a multiple of 4. 15 min x 4 = 1hr , 1hr x 4 = 4hr.
HOW THE SYSTEM WORKS:
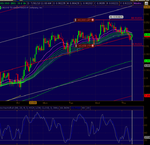
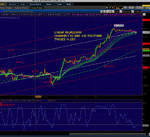
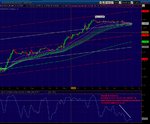
What this system uses is 7 emas (Exponential Moving Averages) at 20,30,35,40,45,50,55. A Full Stochastic Indicator(SI) with settings of 9/3/3 and 80/20 Over Bought / Over Sold lines, with %K being our trigger line. 50 and 100 Regression Channels and Fib Lines. And also a 200ema added for Exits and Profit Targets and to get a since of the trend at a glance.
What you wait for is the emas to fan out, which indicates a strong trend and we only take trades with a strong trend, period. We don't trade chop aka consolidation. Once the trend is strong we then look for pullbacks using the great SI.
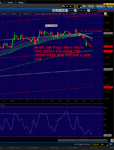
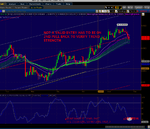
The SI is far more powerful in trending markets once a strong trend is developed. I will then depending on which way the trend is going will wait for Over Bought(OB) and Over Sold(OS) conditions with the SI, meaning %K has dropped below the OB/OS line and I will then wait for a close above the 80 or 20 OB/OS line. I only pay attention to %K. %D I do not pay attention to at all and usually I will just show %K on my charts and have %D hidden.
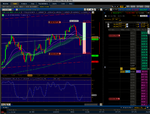
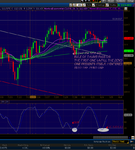
Once a strong trend has developed, meaning the emas are fanned out and wide, I will look for the SI to become OB or OS. Once the SI (which will now be referred as %K) drops below the OB/OS lines I will wait for the current candle to close above or below the 80/20 lines. Depending on what time frame I am using: say a 15min time frame and I'm looking long.
The 15 min candle has to close above 20. Once it closes I will then wait for the next candle to stay above and close above as well. This is very important and it means that you don't jump the gun.
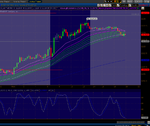
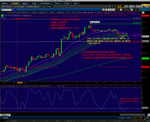
For newly developed trends I will wait for the 2end pullback of the SI-%K. Meaning that a trend that is newly formed I will not take the first pullback but instead take the 2end one because the trend is more established at that point. So I never take the first pull back when the emas are just starting to fan out. Looking at the attached screen shots will helped a lot in showing you what I mean. I would advise you pick 3 pairs and stick with them and only trade them.
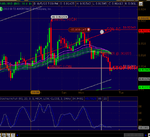
I have set my first 2 emas to be green and the other 5 as pink. If the 2 greens undercut or over cut the pinks consider the trend over.
You are not trying to force anything. You let the market come to you, you don't chase the market because you will loose. This requires patience, discipline, and a written plan of action. You must clearly state which 3 pairs you will trade. Trading is a business and business can be really good but you must first see yourself as a success long before your efforts will be rewarded. Patience is the most under valued asset in trading. With this system you must practice patience everyday because you let the market come to you, not the other way around.
STOPS and TARGETS: If the Risk Reward (RR) is not higher then a 1/1 I will not take the trade. I look for 1/2 or 1/3, but will take a 1/1 RR trade as well. And I always look at my wins and losses in a form of a percentage. ie I will risk 2% of my account to gain 4% and I do a lot of rounding of numbers to keep the math a little easier.
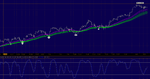
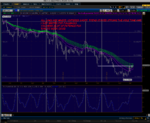
For STOPS: I use the last swing low as a stop or if I have a regression channel nearby I will use that as a stop or a close fib line. I have my charts set up to show 5 regression channels. They are automatically placed added as a study. I use Think or Swim(TOS). The channels are as followed 0% , 25% , 50% , 75%, 100%. Standard Deviation is a very powerful tool for trading and is used in this system. Also Fib Lines are powerful, I zoom out to a monthly and use old data to set my lines. Zoom out to a 20 year monthly and set them. I have it set to show all of the retracements for the fib lines. Depending on the set up, I may use a fib line as a stop or target depending on the trade or a regression line(RL). Sometimes you may not have a swing low that is not reasonable, in that case you would not ever risk more then 2% of you account on any trade which is a rule of thumb for this system.
For Profit TARGETS: I will use the last swing high, fib lines or RL's. I look also for 0's and 50's which are common targets by big intraday traders. I use them as well since they use them. But that it more for intraday trading. Since you are always buying or selling on a pull back there will always be a swing high or swing low for a profit target waiting there for you in a strong trend, which is why we only trade in strong trending conditions. If its chop and all 3 of your pairs are not fanned out with the right conditions, wait till the next time you look. I will not take the trade if its not more the RR 1/1. If the Profit target is hit and you want to move your stop right underneath it you can. If the SI is embedded and your long you can stay in the trade all the way till the becomes OS again as long as your stop remains at the initial profit target. But for the first couple months of using this system just take the initial profit targets until you get the hang of it.
POSITION SIZE NOTES How you judge how many lots to buy is by how wide is the R/R and how not to risk more than 2% of your account. Say for example you have a R/R of 1/2 / 30/60 pips. Those 30 pips of loss cannot represent more then a 2% equity loss to your account.
Say you trading the EUR/USD and a 50k lot represents $5 per pip. You have a $10,000.00 size trading account. $200.00 = 2% Remember to try and learn to think in percentages instead of raw numbers. That 2% will always change after every trade so technically you should account for a $100 gain into your 10k account making it 10,100 which would change your 2% risk size. So thats why I like to round numbers down or up and think in percentages. So 30 pip loss cannot not equal more than $200. So if I take a 60k lot which is $6 per .10 or 1 pip I then say 6 x 30 = 180 well 7 x 30 = 210 so I am over so I have to go with the 60k lot size. So for the final math 6x30 = $180 of potential loss or 1.8% compared to 6x60 = $360 of penitential gain or a 3.6% gain. Final R/R = rounded 2/1 or just think" I am risking 1.8% loss for a 3.6% gain".
That is how you factor in position size. You have a golden ratio of 2% no matter what, you stick with that golden ratio and use it for every trade. It does not matter if its a day trade or a swing trade. If you want to use 1% be my guest just do the same math. 1.5%... it's up to you, just stay consistent.
Another important factor to consider as far as position size is this. If you use smaller time frames your swing lows for stops will be less then your swing lows for the 4hr. Example: Your 15min stops will be significantly smaller then your 4hr stops as far as a raw number of pips, keep that in mind. You can take a much larger position for a 15min set because your actual stop as far as pips is small as compared to a 4hr set up. But all this depends on the setup. And this all depends on your account size as well.
This system might have you checking your screen a lot. You pair may have a very strong trend and all the emas are fanned out and the SI is OS. You dip is there it's happened now you just need the patience to wait for it to close above 20. Depending on when you look, you may have great set ups waiting for you and your in or you will have to come back when you think the rules will be met. You might see that %K just broke down below OS and now you have to wait for it to break threw on a closed candle before you pull the trigger. Again patience is key.
Pick 3 pairs that are independent. Like AUD/USD , GBP/CAD , EUR/JPY , these pairs are all different meaning you won't run into hedging problems. Another good combo is AUD/JPY , GPB/USD , EUR/CAD. Watch these in all time frames. Whatever comes first take it, meaning if a 15min trade is ready take it, dont worry about it conflicting with what the 4hr is saying because you will always have conflicting signals with different time frames. What the 1hr says, the next time frame up; the 4hr says something else. Pull the trigger when the system tells you to on any of the 3 time frames, the 15min, the 1hr, the 4hr and these are your time frames for Quadpips.
Mindset You may have read plenty of great trading books threw out your trading life and you find yourself wondering why you can't gain an edge. Let me tell you what your most powerful edge is. Your mindset. The people from all these great trading books are great traders and have great systems but when it comes time for you to do exactly what they tell you to do you can't follow threw. You can't adopt there mindset is the reason why. Mindset is the most important and underrated thing in the market besides patience. Those 2 things, Mindset and patience will take you very far. How do you adopt the right mindset? It's as easy as starting right now. Your belief system has core values and fears.
Start saying to yourself " I'm a winner. I am a success, I am constantly learning, I surround myself with positive influences and I am a great trader." I have made the decision to be a successful trader. Say these words over and over. Meditate on them, and let them become your essence. I am a master I am great at trading. They are only words until you absorb them. With the right mindset about trading you have the most important edge in the game. Trading in the zone is how I would describe the mindset that you would birth. Without getting to much into mindset I will leave you with that for now. I will be starting a new blog post were I will dive into the Quadpips system showing you weekly updates and further talks about mindset and offer meditations to discover you hidden potential for trading in the zone. I am excited to start a blog about my system and talking about how we can discover peace with the fx markets.
FUTHER NOTHES ABOUT THE QUADPIPS SYSTEM: This system only works in markets that our trending. We don't trade chop or consolidation. This is a good thing because we use the idea of "The trend is your friend". We look for strong trends and wait for pullbacks and make sure to wait for conformation using the SI. 15min trends form faster then 1hr, 1hr trends form faster then 4hr trends. That is why I always wait for the 2end pullback to verify that the trend is real and strong. As with any system its best to keep a journal and take before and after screen shots and put those in a folder and take notes. Also a trading plan is very good to have as well. This plan indicates what to do and when to do it. Treat this like a business and paper trade this for 1 month before going live.
QUESTIONS: I will try to answer questions as they come about the system, backtesting, datamining, meditation, mindsets, and my blog at http://quadpips.blogspot.com/ If anyone follows the cowabunga trading system I will try to do what he does and post updates as much as I can and answer questions on my blog and here. I have to post a lot of screen shots cause they really help people understand this system at a glance.
Please feel free to ask me anything I hope you enjoy this system as much as I have.
This system is fractal meaning it works on all times frames. I use the 15 min chart for intraday trades. 1hr chart for maybe a day or 2, and then the 4hr chart for longer term trades 2-6 days. Notice each time frame is a multiple of 4. 15 min x 4 = 1hr , 1hr x 4 = 4hr.
HOW THE SYSTEM WORKS:
What this system uses is 7 emas (Exponential Moving Averages) at 20,30,35,40,45,50,55. A Full Stochastic Indicator(SI) with settings of 9/3/3 and 80/20 Over Bought / Over Sold lines, with %K being our trigger line. 50 and 100 Regression Channels and Fib Lines. And also a 200ema added for Exits and Profit Targets and to get a since of the trend at a glance.
What you wait for is the emas to fan out, which indicates a strong trend and we only take trades with a strong trend, period. We don't trade chop aka consolidation. Once the trend is strong we then look for pullbacks using the great SI.
The SI is far more powerful in trending markets once a strong trend is developed. I will then depending on which way the trend is going will wait for Over Bought(OB) and Over Sold(OS) conditions with the SI, meaning %K has dropped below the OB/OS line and I will then wait for a close above the 80 or 20 OB/OS line. I only pay attention to %K. %D I do not pay attention to at all and usually I will just show %K on my charts and have %D hidden.
Once a strong trend has developed, meaning the emas are fanned out and wide, I will look for the SI to become OB or OS. Once the SI (which will now be referred as %K) drops below the OB/OS lines I will wait for the current candle to close above or below the 80/20 lines. Depending on what time frame I am using: say a 15min time frame and I'm looking long.
The 15 min candle has to close above 20. Once it closes I will then wait for the next candle to stay above and close above as well. This is very important and it means that you don't jump the gun.
For newly developed trends I will wait for the 2end pullback of the SI-%K. Meaning that a trend that is newly formed I will not take the first pullback but instead take the 2end one because the trend is more established at that point. So I never take the first pull back when the emas are just starting to fan out. Looking at the attached screen shots will helped a lot in showing you what I mean. I would advise you pick 3 pairs and stick with them and only trade them.
I have set my first 2 emas to be green and the other 5 as pink. If the 2 greens undercut or over cut the pinks consider the trend over.
You are not trying to force anything. You let the market come to you, you don't chase the market because you will loose. This requires patience, discipline, and a written plan of action. You must clearly state which 3 pairs you will trade. Trading is a business and business can be really good but you must first see yourself as a success long before your efforts will be rewarded. Patience is the most under valued asset in trading. With this system you must practice patience everyday because you let the market come to you, not the other way around.
STOPS and TARGETS: If the Risk Reward (RR) is not higher then a 1/1 I will not take the trade. I look for 1/2 or 1/3, but will take a 1/1 RR trade as well. And I always look at my wins and losses in a form of a percentage. ie I will risk 2% of my account to gain 4% and I do a lot of rounding of numbers to keep the math a little easier.
For STOPS: I use the last swing low as a stop or if I have a regression channel nearby I will use that as a stop or a close fib line. I have my charts set up to show 5 regression channels. They are automatically placed added as a study. I use Think or Swim(TOS). The channels are as followed 0% , 25% , 50% , 75%, 100%. Standard Deviation is a very powerful tool for trading and is used in this system. Also Fib Lines are powerful, I zoom out to a monthly and use old data to set my lines. Zoom out to a 20 year monthly and set them. I have it set to show all of the retracements for the fib lines. Depending on the set up, I may use a fib line as a stop or target depending on the trade or a regression line(RL). Sometimes you may not have a swing low that is not reasonable, in that case you would not ever risk more then 2% of you account on any trade which is a rule of thumb for this system.
For Profit TARGETS: I will use the last swing high, fib lines or RL's. I look also for 0's and 50's which are common targets by big intraday traders. I use them as well since they use them. But that it more for intraday trading. Since you are always buying or selling on a pull back there will always be a swing high or swing low for a profit target waiting there for you in a strong trend, which is why we only trade in strong trending conditions. If its chop and all 3 of your pairs are not fanned out with the right conditions, wait till the next time you look. I will not take the trade if its not more the RR 1/1. If the Profit target is hit and you want to move your stop right underneath it you can. If the SI is embedded and your long you can stay in the trade all the way till the becomes OS again as long as your stop remains at the initial profit target. But for the first couple months of using this system just take the initial profit targets until you get the hang of it.
POSITION SIZE NOTES How you judge how many lots to buy is by how wide is the R/R and how not to risk more than 2% of your account. Say for example you have a R/R of 1/2 / 30/60 pips. Those 30 pips of loss cannot represent more then a 2% equity loss to your account.
Say you trading the EUR/USD and a 50k lot represents $5 per pip. You have a $10,000.00 size trading account. $200.00 = 2% Remember to try and learn to think in percentages instead of raw numbers. That 2% will always change after every trade so technically you should account for a $100 gain into your 10k account making it 10,100 which would change your 2% risk size. So thats why I like to round numbers down or up and think in percentages. So 30 pip loss cannot not equal more than $200. So if I take a 60k lot which is $6 per .10 or 1 pip I then say 6 x 30 = 180 well 7 x 30 = 210 so I am over so I have to go with the 60k lot size. So for the final math 6x30 = $180 of potential loss or 1.8% compared to 6x60 = $360 of penitential gain or a 3.6% gain. Final R/R = rounded 2/1 or just think" I am risking 1.8% loss for a 3.6% gain".
That is how you factor in position size. You have a golden ratio of 2% no matter what, you stick with that golden ratio and use it for every trade. It does not matter if its a day trade or a swing trade. If you want to use 1% be my guest just do the same math. 1.5%... it's up to you, just stay consistent.
Another important factor to consider as far as position size is this. If you use smaller time frames your swing lows for stops will be less then your swing lows for the 4hr. Example: Your 15min stops will be significantly smaller then your 4hr stops as far as a raw number of pips, keep that in mind. You can take a much larger position for a 15min set because your actual stop as far as pips is small as compared to a 4hr set up. But all this depends on the setup. And this all depends on your account size as well.
This system might have you checking your screen a lot. You pair may have a very strong trend and all the emas are fanned out and the SI is OS. You dip is there it's happened now you just need the patience to wait for it to close above 20. Depending on when you look, you may have great set ups waiting for you and your in or you will have to come back when you think the rules will be met. You might see that %K just broke down below OS and now you have to wait for it to break threw on a closed candle before you pull the trigger. Again patience is key.
Pick 3 pairs that are independent. Like AUD/USD , GBP/CAD , EUR/JPY , these pairs are all different meaning you won't run into hedging problems. Another good combo is AUD/JPY , GPB/USD , EUR/CAD. Watch these in all time frames. Whatever comes first take it, meaning if a 15min trade is ready take it, dont worry about it conflicting with what the 4hr is saying because you will always have conflicting signals with different time frames. What the 1hr says, the next time frame up; the 4hr says something else. Pull the trigger when the system tells you to on any of the 3 time frames, the 15min, the 1hr, the 4hr and these are your time frames for Quadpips.
Mindset You may have read plenty of great trading books threw out your trading life and you find yourself wondering why you can't gain an edge. Let me tell you what your most powerful edge is. Your mindset. The people from all these great trading books are great traders and have great systems but when it comes time for you to do exactly what they tell you to do you can't follow threw. You can't adopt there mindset is the reason why. Mindset is the most important and underrated thing in the market besides patience. Those 2 things, Mindset and patience will take you very far. How do you adopt the right mindset? It's as easy as starting right now. Your belief system has core values and fears.
Start saying to yourself " I'm a winner. I am a success, I am constantly learning, I surround myself with positive influences and I am a great trader." I have made the decision to be a successful trader. Say these words over and over. Meditate on them, and let them become your essence. I am a master I am great at trading. They are only words until you absorb them. With the right mindset about trading you have the most important edge in the game. Trading in the zone is how I would describe the mindset that you would birth. Without getting to much into mindset I will leave you with that for now. I will be starting a new blog post were I will dive into the Quadpips system showing you weekly updates and further talks about mindset and offer meditations to discover you hidden potential for trading in the zone. I am excited to start a blog about my system and talking about how we can discover peace with the fx markets.
FUTHER NOTHES ABOUT THE QUADPIPS SYSTEM: This system only works in markets that our trending. We don't trade chop or consolidation. This is a good thing because we use the idea of "The trend is your friend". We look for strong trends and wait for pullbacks and make sure to wait for conformation using the SI. 15min trends form faster then 1hr, 1hr trends form faster then 4hr trends. That is why I always wait for the 2end pullback to verify that the trend is real and strong. As with any system its best to keep a journal and take before and after screen shots and put those in a folder and take notes. Also a trading plan is very good to have as well. This plan indicates what to do and when to do it. Treat this like a business and paper trade this for 1 month before going live.
QUESTIONS: I will try to answer questions as they come about the system, backtesting, datamining, meditation, mindsets, and my blog at http://quadpips.blogspot.com/ If anyone follows the cowabunga trading system I will try to do what he does and post updates as much as I can and answer questions on my blog and here. I have to post a lot of screen shots cause they really help people understand this system at a glance.
Please feel free to ask me anything I hope you enjoy this system as much as I have.
Attachments
-
 trend over.png84.8 KB · Views: 460
 -
 OVER AND OVER.png168.2 KB · Views: 425
 -
 ENTER 2.png147.2 KB · Views: 617
 -
 LINEAR REGRESSION.png137.4 KB · Views: 613
 -
 SKIP FIRST ONE.png94.7 KB · Views: 409
 -
 waiting 15 min aug 2 8pm.png113.8 KB · Views: 416
 -
 NO ENTRY.png134.2 KB · Views: 443
 -
 WATING FOR A GO.png122.2 KB · Views: 435