Price, (Volume), Support, Resistance, Demand, Supply . . .

Interview snips

dbphoenix said:
These links don't take me anywhere. Can you copy and paste the text?

Db,

I'll try again. On my screen everything appears fine and when I click on the link, the link works fine. Listen to the other interviews. Their good:

www.tradertrainingcourse.com/free7a/
tradertrainingcourse.com/free7a/

If you still have a problem, please post the link that I am indicating above, so that I can see the problem.

-Trader2Win


Ps. I had an option on "Automatically parse links in text" which might have be the problem.
 
They still don't work for me, so I'll go at this from a different direction, addressing your comments without regard to whether or not they accurately characterize anything that Williams may or may not ever have said or written (there are several threads in this forum which pertain to VSA and to Williams, so you may want to explore those if you're especially interested in Williams).

Trader2Win said:
Wyckoff principles are not easily explained by Wyckoff.

Wyckoff's principles are explained quite clearly in his original course. Unfortunately, they are explained not nearly as well in most of the Wyckoff books that are available, the Jack Hutson book being the exception amongst what's generally available.


Markets are manipulated often.

Markets, no. Market elements, sometimes. However, whether or not the market segment on which you're focused (commodity, stock, etc) is being manipulated or what the source of any suspected manipulation may or may not be need have nothing to do with your actions or inactions. Focus on price and the behavior of price (or, more accurately, the behavior of traders who are moving the price) and you'll be fine. Otherwise, you'll find yourself in guess mode most of the time, trying to figure out what all of it really means.


The average person knows little about volume. The average person only think of maybe averaging volume, looks maybe at divergence, maybe look at buyers volume and sellers volume. But these really does not mean anything. All these things the average person knows has many flaws in them.

True, which, to a large extent, is what this thread is all about. Part of this -- perhaps a large part -- comes from listening to gurus instead of studying charts. If one studies the charts, much of the "common wisdom" turns out to have little or no foundation at all.


Wyckoff principle boils down to three things:
1) All volume is, is the amount of professional activity that is taking place. You don’t any fancy indicators to see this when looking at volume. You can easily see if professional money has been active or not active on a particular bar.
2) Volume is closely link to market movement. What did market do on this particular volume movement?
a) did prices shoot up and close on a low
b) did prices shoot up and close on a high
c) did it gap up, closing at middle or low
d) did it fall on the volume
e) etc.
This will give a clear indication of the supply and demand present at this point in time.
Volume is simple to analyze. Volume is the amount of professional interest in the market at that time.
3) Supply and demand. For every buyer there has to be a seller, for every seller there has to be a buyer. If we think deeper: If there are more buyers than sellers, the market is going to go up. If there are more sellers than buyers, the market is going to go down. Even then we have to dig deeper: The market shoots off in the opposite direction that you think it is going to go. The reasons for this is: To stop a falling market, any falling market, demand has got to be seen to have overcome supply that caused the falling market in the first place.
In other words: High volume, market closed to the middle or high, with narrow spreads, something has capped the bottom end of the market, showing professional money has stepped into the market, and has overcome the supply, at the end of the day there are more buyers than sellers. If there are more buyers than sellers, the market is going to go up.

1 and 2 are generally true. As for 3, there are difficulties in using the terms "supply" and "demand". There's nothing new about the terms. Wyckoff used them in his work. And from the standpoint of economics, they're perfectly good terms. I used to use them myself.

However, beginning traders tend to equate "supply" with "inventory", and while this may be more or less true with regard to stocks, it does not apply to trading instruments such as futures contracts. Therefore, the image of some sort of overhanging dump is lodged in the mind, and the trader makes unnecessary errors.

Similarly, "more buyers than sellers" (or vice-versa) can be equally misleading, prompting an image of a self-satisfied seller with a big smile on his face being assaulted by hordes of eager buyers, begging him to make some of his inventory available. "Buying interest" and "selling interest" aren't much better since "interest" -- even if you can (a) determine what it is and (b) quantify it -- doesn't mean much unless it's translated into action, i.e., a trade. If and when that trade is made, you can then act on what you see, not on a guess.

Therefore, think instead of buying pressure and selling pressure rather than supply and demand, interest, fevered mobs. What moves price up, after all, is how much buyers are willing to pay for the shares (or whatever). The number of buyers isn't as important as their determination. Granted if they are met with extraordinary selling pressure, they'd better hope for reinforcements. But price can advance quite far for quite an extended period of time with very little "volume" (or trading activity) at all, as long as the buying pressure is greater than the selling pressure. Whether or not there are "more buyers than sellers" is not as important as what those buyers are willing to pay (and what the sellers are willing to accept).

Adopting buying and selling pressures as a concept also enables the trader to free himself from the "bar", which can easily take on unnecessary and misleading importance. As I've said before, the market is not a series of snapshots but a movie. There is a continuous flow to both price and trading activity (volume). The "bar" is nothing more than a convenience for chartists. The market couldn't care less about your bar. Where price closes within your bar is nowhere near as important as where price found equilibrium after its travels up and its travels down, and that can be seen only by going within the bar and tracing its journey. This is a matter of course when trading real time, unless one visits his screen for only a few seconds, then leaves for fifteen minutes (or whatever), then revisits, then leaves again and so on.

Those who don't use charts understand this easily. They tune into the flow of price, noting its pace, its spurts, what levels it repeatedly visits and recoils from, the levels at which it finds equilibrium, the "tension" during congestions and consolidations. Focusing on the "bar" can and often does result in a quest for the "best" bar, or the best "type" of bar, which is largely an avoidance of looking at and studying price itself.


People are usually mislead because the market is plummeting down and the news is bad. People are then fearful and dump there shares. But this is exactly when the market will turn producing a Hammer signal with high volume.

It may produce a hammer, but the hammer is not necessarily a signal. The hammer may signify nothing more than a selling climax, which is not necessarily a buy signal. According to Wyckoff, after a selling climax, there will be a technical rally. Then the low is tested. Then you've got the "real" rally, if you get one at all (sometimes, as in 2002, the selling climax occurs before the real bottom, in which case there is more work to do before the stock or index or whatever can advance, in which case price will bounce along that bottom for quite a while before a "buy signal" is generated).


The same thing will happen at the top of a market: What will stop a bull market rally, is that supply has to be seen to have overcome demand that caused the up move in the first place. That will mean very high volume on that bar, spreads will probably narrow and markets will close in the middle or low, you will immediately know especially if it is in new high ground, the professional traders have stepped into the market, dumped massive amounts of stock all to the ever eager buyers.

See earlier comments about supply and demand. There are also issues of pace and time and energy (congestions, consolidations, breakouts, parabolic moves, hinges, springboards), but there's enough theory and philosophy in these threads as it is, and practical application requires charts and examples. There are buckets of charts posted here (and in some of the threads below) which may be helpful. If not, feel free to post your own.
 
Limited price and volume data

Thanks Db,

To the the Board:
Assumptions:
1) A long position was taken on the first bar of each scenario (A to F).
2) We usually trade a maximum of 21 trading days, but we might exit a trade the following day (after entry) if extraordinary profits occurred or we were stopped out.
3) The price and volume of the preceding days are unknown.
4) No definite support and resistance levels are close the action.
5) We do not have the open or close of the bars.
6) We are still in a long position (this is to give an indication of the level of our risk tolerance).

Question:
7) What kind of emotions (or use any indicator to express an opinion) do the following six scenarios cause?

Trader2Win
 

Attachments

  • PriceVol.JPG
    PriceVol.JPG
    27 KB · Views: 286
Trader2Win said:
Question:
7) What kind of emotions (or use any indicator to express an opinion) do the following six scenarios cause?

Trader2Win

Not sure what you're going for here. If the trader has no plan other than to stay in his trades for up to four weeks, he could be feeling anything. Or nothing at all. If you're trying to make some connection between trading activity and price movement, there isn't anything notable here without context.
 
Trader2Win said:
Db,

Do those six scenarios have the same meaning for you?

Trader2Win

For me, with no plan and no context, they have no meaning at all other than I'm long and price is rising. Are you looking for some sort of prediction or "gut" reaction?
 
dbphoenix said:
For me, with no plan and no context, they have no meaning at all other than I'm long and price is rising. Are you looking for some sort of prediction or "gut" reaction?

Db,

I think prediction is difficult, but some might say it is possible to some degree (i.e. Although I am not predicting what is going to happen, it does look like price in scenario A is running into some kind of resistance). Interest in the current trend is declining.

I am not looking for anything except comments on what looks like a few very basic charts.

Trader2Win
 
Without context, you have no way of knowing whether price is running into R or not. Be careful to avoid assigning meanings according to what's in your head rather than to what's on the chart.
 
trouble interpreting it all...

dbphoenix said:
Without context, you have no way of knowing whether price is running into R or not. Be careful to avoid assigning meanings according to what's in your head rather than to what's on the chart.

I'm trying very hard to understand the relationships that move the market. Based on essentials like support and resistance I try to determine a direction of the trend. Price is the main element I focus on, using volume to support my hypotheses. Therefore I believe I've read and studied enough material (mainly the posts of dbhoenix on ET and your excellent PDF files and noted charts).

Unfortunately it doesn't really seem to work out, I've been trying at this for a couple of months now and each time I think I got/see something and implement it after succesfull backtesting, it just doesn't seem to work quite as often as I wish it to be.

Can you give me any feedback? Lamont_C from ET said you'd be more than willing to give me support or suggestions to help me out. I'm trying to look at this from other perspectives but don't know what I'm missing or doing wrong here.

Attached you find a first chart where I noted my entry point.
 

Attachments

  • 28072006-et1.JPG
    28072006-et1.JPG
    170.1 KB · Views: 504
another couple of charts

I hope I'm not posting to much charts, but I'd like to illustrate my strategy or method by using some examples. I don't use any other indicators. I place an entry after I see two or three bars hitting a support/resistance line, never on the first tick. Furthermore I enter when I see triangles forming, this one especially has worked out quite well as I've often been right in "predicting" the way the outbreak would move, although there a lot's of false outbreaks too.

I would appreciate anybody who can comment on this and give me his/her opinion.
The only thing I want to do is learn and get better at this, but it seems as if the learning curve is more steeper than I thought. Although others claim you can't get this in your fingers after a couple of months, you need at least a couple of years, I believe that's rubbish.
 

Attachments

  • 240706-3.jpg
    240706-3.jpg
    202.1 KB · Views: 294
what to make of this?

this one made me especially confusing
 

Attachments

  • 260706-4.jpg
    260706-4.jpg
    177.2 KB · Views: 285
I thought this one was a clear double bottom?! perhaps a W shaking out but nevertheless I believed it was going up. Which it did... but then turned back again so I was stopped out...

I look forward to hearing any comments.

I'm trying not to make the "common" newbie mistakes like:
-> being emotional
-> overtrading
-> not following your system
-> not taking a loss

In fact, I'm taking every loss and try to stay cool with it. But the losses have accumulated to a high which is getting very hard to digest... it's not that losses are big, no on the contrary but when you have like 10 trades in a row going in the wrong direction, than even if you have 3 profitable ones where the profit is higher it won't make up for the losses... I'm using a risk:reward ratio of 1:3, that's not too much is it?
 

Attachments

  • 28072006-et5.JPG
    28072006-et5.JPG
    165.4 KB · Views: 291
more info about my strategy

I start the day with checking the following:

-> any news releases today (stay out of those zones)
-> check out last week + last month chart
-> check out where last day ended/started
-> draw S/R lines from the last week/month
-> don't trade the openings

Then when I see a pattern forming, I try to place a trade.
I place around 5-10 trades a day, perhaps it's not enough? Perhaps I should aim for more trades? Perhaps I'm too hard at trying for a perfect entry trade and let go of others that could have been profitable? What are the thoughts on the matter?
 
mr.marcus. Does your analysis wotk with currencies or is only on centrally exchanged markets, indicies and stocks. I only ask as its OTC and the big money is not all in one place and I didn't know wether that would throw a different angle upon it?
 
mr.marcus said:
ps...in fact all the examples in your charts are very self explainatory but db can go thru the others im sure.....

I can understand that they are self explanatory to someone like you, but to me they make no sense at all... at chart 1 I can understand your argument and there were other points that should have made me question if there was going to be an up move (like breaking of trendline and not making a new high). But let's take the last chart I posted, (where I believe to see a selling climax). It does go up AGAIN after the last point visible on the chart, until it finally drops below the support. But in this case I thought they were more then plenty upbars (spikes, hammer,...) to suggest it was the lowest point for now.

I've included a continuation of the chart... I'm quite interested in understanding how you could explain this one. Perhaps I'm getting it all wrong here, than it's better to let me know sooner than later, perhaps I'm misunderstanding it or looking at the wrong things?
 

Attachments

  • 28072006-3.JPG
    28072006-3.JPG
    198.5 KB · Views: 243
dbphoenix said:
Of course, "high" is relative and has little meaning unless it is placed within the context of a chart. One man's selling climax is another man's continuation unless one looks at the forest.

I agree that volume has to be looked at in comparison to other points of the chart. Also the time of day can make a difference. Included a chart where I believed it to be a SC, at about 11:40. But it continues to go lower till around 13:20, after which the selling is over. I know the market can do anything at any time, but this one troubles me, I can't seem to find a reason as to why the market goes down after 11:40. Even though I don't need to understand everything to be succesfull as a trader, if I keep entering at these signals that mislead me, I'm in need for a better understanding as to why I'm getting it wrong most of the time...
 

Attachments

  • 28072006-3.JPG
    28072006-3.JPG
    198.5 KB · Views: 245
[Note: all of this is in response to your first post.]

Well, first, firewalker, you shouldn't be trading with real money at all until you have this nailed. There is no virtue in learning by burning up your equity. If you have no trading plan that comes even close to being consistently profitable, then your entire approach is based on hope. And now fear. Therefore, your focus is shifting from learning how to trade price to learning how to avoid losing your money, and this is not the best place to be in order to develop as a trader.

You've asked some good questions and, for the most part, they are well within the scope of this thread. However, questions regarding strategy and tactics are more appropriate to a journal since they are specific to you and since they will likely be ongoing, and this thread is plenty long as it is :)

Therefore, I'm going to limit myself to principles here -- or try to -- even though that won't be nearly enough. If you truly want to master this, I suggest you open up a journal (http://www.trade2win.com/boards/forumdisplay.php?f=164) so that we can get into where you should enter, where you should exit, what kind of stops you should use and where, and all the other details of whatever it is you decide to do in your particular situation.

I've looked at Lamont's comments and I concur with everything he says. Somewhere you got off track. But rather than review what's already been reviewed here and elsewhere ad nauseum in order to figure out exactly where you wandered off into the weeds, let's focus on your charts, one at a time. This is, in a way, a sneaky means of reviewing principles, but doing so through application, which is the only way many people can learn, and which is the reason why I've begun focusing on application -- such as with the S/R thread -- rather than get involved in yet more discussions on theory and philosophy which invariably turn out to be discussions of what has already been discussed over and over again.

So.

First, it's clear that you've put a great deal of time and thought into this, which is good. And encouraging. However, you refer several times to this stuff "working". Support, resistance, and price are not a method or a system. The analysis of all this is an investigation of how markets work, i.e., how traders trade. Once you understand the dynamics of how buyers and sellers interact with each other, it is then up to you to determine how best to take advantage of those interactions. In other words, there will be no flashing red arrows which say "enter here".

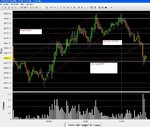
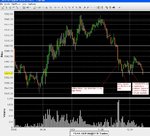
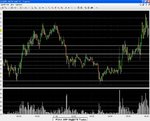
Second, it's always easier to see thru the window after one cleans the glass, so I've reduced your first chart to the basics, i.e., price and volume (though even volume is not necessary, as you will see, and may even be a distraction). Since this takes some doing, I'd appreciate it if you'd convert your charts to what I have below: no channels, no S/R (support/resistance) lines, no trendlines, no colors other than black and white.

Now. For the sake of simplicity, let's assume that life begins at the left edge and not get into the backstory here (otherwise, we could be here all day). Note that price hits 5655 and recoils from it. It then drops below it to 5647.5, then rallies back to 5655 where it is halted. Ah Ha! Resistance? Probed once from the topside (twice if you count the drop through) and now from the bottom side. This should cause a Hmmm on your part, something to pay closer attention to. Price then waffles around (and when I say Price I mean buyers and sellers) for a few bars, probes 5655 again, then falls. However, when it drops below the last swing low (LSL) at 5647.5, it rallies back in the same bar to close well off its low (if you were to look at a tick chart of this, you would see the wave of the dynamics of the exchange between buying pressure and selling pressure rather than a "bar", which would enable you to understand candlestick voodoo much easier and avoid assigning quite so much "meaning" to candlesticks and candlestick patterns). It's the closing well off the low that matters, not the color of the bar since buying pressure had to exceed selling pressure in order for this to occur. The volume bar tells you how much trading activity accompanied this movement. But what matters is the movement of price since that's where you make or lose your money.

But this particular test is not yet over. Sellers push price down again, and this time the trading activity increases. But what happens? Going back to what Wyckoff describes as effort and result, traders put more effort into this movement (more trading activity, i.e., higher volume) but the result is that price not only rebounds above the low of the previous bar (or the previous swing low if you're looking at a tick chart), but it also rebounds above the close of the previous bar, creating a potential shakeout (you mention my pdfs; the description of the shakeout is in Demand/Supply, so I won't go into that again here).

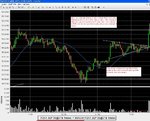
The proof, however, is as they say in the pudding. Look what happens to price now. It rallies all the way back to R (resistance) rather than plunge lower, suggesting that what looks like a shakeout really is a shakeout. It then breaks above R. Do you take this or not? And here's one example of where trader-specific strategies and tactics depart from "principles". There is no inherent good in taking or not taking this BO (breakout). You can determine in part whether or not to take it by developing and testing a trading system (or method or strategy or whatever you want to call it) which incorporates trading BOs. If that system as you've designed it is consistently profitable, then by all means take the BO. If it isn't, don't.

But whether you take the BO or not, traders again waffle around here, and while the waffling can be frustrating and even prompt you to exit, the waffling does confirm the importance of this level or zone (if it weren't important, price would breeze right through it). There is yet another quick downdraft, and this time on heavy volume, i.e., substantially increased trading activity, the highest so far. Lots of effort here. And what is the result? Again, price closes well off the lows, i.e., both buying pressure and selling pressure increase (more trading activity), but buying pressure wins the day. What matters, in other words, is not so much how far price travelled downward, but where it ended up. This tells you who -- for the moment at least -- is in the driver's seat. And if you have not yet bought the BO, you'd have a bit more confidence in doing so now.

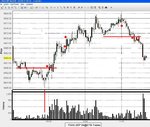
If you don't, you can wait for the retracement (RET), which is where I've placed the second red dot. RETs disturb many novice traders because they think they screwed up. They want to reach their target as quickly as possible. If they don't, they think they're in trouble. So they cut their profits short. But rather than descend into flop sweat fear, focus on what a RET represents to those who didn't buy the BO. This is their second chance. And if they take it, you may be in for a nice, profitable ride (if they don't, you perhaps have -- and reasonably so -- a stop at BE by now and aren't especially concerned about it one way or the other). If you're one of the people who waited, you can enter now. However, this is next best to taking the BO since your risk is higher. You entered "late", placing you in the ranks of "weak hands" (i.e., the first to bail when the going gets rough because they have no cushion or buffer). If you wait even longer for further confirmation and buy (the third dot) when price BOs past the last swing high (LSH), your risk is higher still, and you'd be in the red almost immediately, though ultimately, if you insisted on hanging in no matter what the risk, you might make a few bucks, or at least BE.

By now, you have a higher high (HrH) and a higher low (HrL). The third dot represents the next HrH. Therefore, until you fail to make a HrH, you are in an uptrend. Shorts are not an option. In fact, depending on your particular strategy, shorts may not be an option even if you have a LrH if the LSL is still intact (more on this later). Price continues its ascent, finally retracing its progress to find S (support) at the previous swing high at 5667.5 or thereabouts. Entering here would be ultra-conservative given all the confirmation but it would also be near-suicidal. The weakest hands would enter even higher still, at the new high, which is where panic sell-offs are conceived. It then rallies yet again, making what is in hindsight "the high".

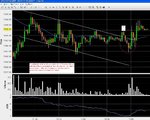
But what now? You're trading in real time. Hindsight is a luxury you don't have (and note that I've said nothing about volume so far exc with regard to the shakeout because it's not esp relevant or even helpful). What does price do? It retraces. But how far does it retrace? Does it drop below the LSH at 5677.5? Hmmm. Seems a bit weak, doesn't it? But you're up almost 40pts, so a little rest is in order, not unusual. Perhaps price will consolidate here for a while and buyers will prep themselves for a push to a further advance.

And, apparently, they do. But when price reaches the previous high, it runs into trouble (if you're waiting until now to go long, I can't help you :)). It appears to form a double top (or a LrH if you're using candles and pay more attention to the bodies than to the wicks). Here again volume can be helpful to you since the trading activity here is FAR less than it is on the previous high, suggesting a lot less buying interest (not so much because of the amount of trading activity per se but because price isn't rising). Thus, if you were to SAR here (stop and reverse), you'd lock in the profits on your long and be at near the best possible position for your short (near best because your stop could be so near). This last, however, gets into strategy and tactics and is best left to your journal, if you choose to pursue this.

If shorting there is too aggressive for you, you can wait until your trendline is broken (not drawn in here, but I hope it's obvious) and the reversal confirmed, i.e., a drop below the LSL, which is where I've drawn the lateral red line at about 5671. Note that it is on the way down to this line that the trading activity increases. The importance of this line is confirmed by the extreme dryup of trading activity just before price breaks thru this line and the teeny-tiny bars that are the result of that activity. Then donk!, at which point you might want to enter your short, even though the stop must be much farther away and your risk much higher.

Again, you can wait for the RET, though this one repenetrates -- temporarily -- the S/R line (the last red dot). This is safer and represents somewhat less risk, not so much because of the price entered but because of the confirmation of weakness and because of the possibility of a tighter stop. But there clearly is weakness here along with a confirmed reversal. There is no long here, only shorts. (If somehow buyers manage to pull it together and reverse the reversal and make yet another attempt at a higher high, you at least are out with a profit on your long and perhaps a tiny loss on your short. And it happens. But that's the difference between trading in hindsight and trading in real time.)

Then, of course, WHAM! The weak hands cry Uncle and you've plunged 25pts.

As for predicting, don't even bother. Even if the attempt weren't so difficult for the novice (and often the not-so-novice) and didn't take so much time, it wouldn't matter. If and when you thoroughly understand what's happening in front of you, you'll know what to do, or at least what is likely to be the most appropriate course of action. If you allow yourself to sink into the muck of the minutiae of what each itty-bitty bar "means" and how it "relates" to every other itty-bitty bar, the trade will be long gone before you ever decide what it is you should do. Focus instead on the setup, on the conditions for the trade. This is where principles will guide you. But you must then decide exactly what it is that you're going to do if and when the conditions are right. Predicting what will or won't or might or might not or should or shouldn't happen after the trade is entered is wasted brain time. Knowing what you will do if and when certain events happen is part of your tactics and has been planned out long before.

But this is long enough now. If you have no questions, do you want to take a shot at your next chart? Or do you want me to do it? Either way, I'd appreciate your reposting it as I requested: no lines, no colors other than black and white, preferably no candles.

Db
 

Attachments

  • firewalker.jpg
    firewalker.jpg
    108.5 KB · Views: 444
dbphoenix said:
[Note: all of this is in response to your first post.]


Db

First of all I'd like to thank you for your time making this a very thoroughly and detailed answer. I appreciate the time and effort you put in these to answer it.

I'll try and adjust my charts for future reference in b/w.
Apart from that, I must say your "step-by-step" guide following this chart is very interesting for me. I'll get back to you later about your reply, but study it some more first. Before I try it myself, I'd ask you to review my last chart, if you could analyse and comment on that one, I think it could clear up my head a bit. Next week I will be papertrading as I believe my losses have amounted too much and I'm trying not to be emotional about it - but it's not that easy. Now the only target for me is to get a clear understanding of it and put my theories back to the test although I must note that I've had several profitable days always. Albeit you might argue this was just luck, I hope all my time and effort waren't in vain and I'm going totally the wrong way. If so, please let me know, otherwise I'm looking forward to your comments.
 
firewalker99 said:
I agree that volume has to be looked at in comparison to other points of the chart. Also the time of day can make a difference. Included a chart where I believed it to be a SC, at about 11:40. But it continues to go lower till around 13:20, after which the selling is over. I know the market can do anything at any time, but this one troubles me, I can't seem to find a reason as to why the market goes down after 11:40. Even though I don't need to understand everything to be succesfull as a trader, if I keep entering at these signals that mislead me, I'm in need for a better understanding as to why I'm getting it wrong most of the time...

A quickie here, since you referenced something I said and apparently directed your question to me, and I don't want to appear to be ignoring it.

You weren't wrong. 1140 was in fact a selling climax (the SC). But a selling climax does not necessarily mean an end to the move. An SC is equivalent to stomping on the brakes at high speed: even though the brakes are applied, the car continues to move forward. Or compare it to throwing up. The big chunks come first and fast, but you continue to toss it up even so, eventually ending in dry heaves. (And I use this analogy because so many of The Wise use vomiting as a metaphor for capitulation.) In this case, the SC is a big red flag, but not necessarily a "buy" signal. Same thing happened with the market as a whole in 2002. The SC occurred long before the eventual bottom. And there was no buy signal (at least none in my book) until spring of '03.

In any case, note where price stopped after the SC: dead on the S/R line where all of this started. And the importance of this line is confirmed again and again by the repeated tests of it during this consolidation (and the weakness of buying interest by their inability to push price above what appears to be 5662.5).

Then, when buyers finally yield and allow price to find equilibrium, or try to, it spends no time at all at the next low but immediately tests yet again that S/R zone. The fact that it breaks back into it is as strong a signal of serious buying interest as you're going to get in this world (if the buying interest weren't there, price wouldn't have risen). Not that I would go long here, but, if I did, I could have a hell of a tight stop.

To try to predict all of this, though, would not likely have had any benefit to you, assuming that you could do it. Attempting to predict these movements would more likely guide you toward a bias and prevent you from seeing what was in front of you, or, as Douglas put it, prevent you from "being available". These perceptual biases are often the cause of hanging on to losing trades.

Db
 
Top