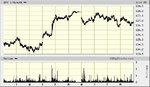
Price, (Volume), Support, Resistance, Demand, Supply . . .

erierambler said:
In Wyckoff terms the SPX is on the hinge ( springboard). :cool:

erie

On the basis of an every decreasing range culminating in a flat line (which is impractical) therefore a break up or a breakdown?
 
bracke said:
On the basis of an every decreasing range culminating in a flat line (which is impractical) therefore a break up or a breakdown?

We will see if it tests the recent low or breaks the uptrend line first. It appears the last week has not made a higher high from the week before. Lots of time to see an opportunity, one way or the other.

erie
 

Attachments

  • SPX.gif
    SPX.gif
    17.8 KB · Views: 275
WOW!!! What a thread. Took me a while to read it, think about it, digest it and practice it but well worth it I think. I have watched real time charts as much as possible when attempting to apply these ideas as that seems to be the general theme of this thread. However, due to time constraints I have been trying to nut out an EOD trading strategy.

So a couple of questions.......

1: Besides the general principles of S/R, trend and patterns how else can one go about analysing P/V when looking at EOD charts? Is it truly possible to do so or is this type of study and analysis really only useful if one can do it real time to see where the bulk of the trading activity took place.

2: Is there any testing software that can test strategies based on these ideas. As S/R lines, trendlines, chartpatterns etc are so subjective, I can't see how the ideas could be put into a piece of software to test. It seems to me that only paper trading historical data would provide an idea as to wether a strategy would work or not. If there is some sort of software that could test it then I'd love to get my hands on it.

Cheers,
PKFFW
 
PKFFW said:
Besides the general principles of S/R, trend and patterns how else can one go about analysing P/V when looking at EOD charts? Is it truly possible to do so or is this type of study and analysis really only useful if one can do it real time to see where the bulk of the trading activity took place.
The analysis if PV is valid across all timeframes. The choice of timeframe used is largely arbitrary.

Lower timeframes 'feed' the higher ones: Higher ones 'influence' and provide context for the lower ones.

So doing your analysis over more than one timeframe could be useful. :cool:
 
PKFFW said:
1: Besides the general principles of S/R, trend and patterns how else can one go about analysing P/V when looking at EOD charts? Is it truly possible to do so or is this type of study and analysis really only useful if one can do it real time to see where the bulk of the trading activity took place.

2: Is there any testing software that can test strategies based on these ideas. As S/R lines, trendlines, chartpatterns etc are so subjective, I can't see how the ideas could be put into a piece of software to test. It seems to me that only paper trading historical data would provide an idea as to wether a strategy would work or not. If there is some sort of software that could test it then I'd love to get my hands on it.

Cheers,
PKFFW

1a. What else other than S/R, trend, etc, do you want to know about analyzing price action?

1b. If one is using EOD charts only, he can get a sense of the flow of price and of the dynamics between buying and selling pressure by plotting a chart with intraday data. For example, plot 1m bars and zoom out as far as possible to get a continuous line. Being able to plot volume as a line rather than as a series of bars is also a plus, though not critical. One can also use "replay" and set it for a multiple of normal speed, e.g., 10x.

2. No. Regardless of the claims that are made, no.
 

Attachments

  • Image7.jpg
    Image7.jpg
    54.6 KB · Views: 1,554
Last edited:
dbphoenix said:
1a. What else other than S/R, trend, etc, do you want to know about analyzing price action?

1b. If one is using EOD charts only, he can get a sense of the flow of price and of the dynamics between buying and selling pressure by plotting a chart with intraday data. For example, plot 1m bars and zoom out as far as possible to get a continuous line. Being able to plot volume as a line rather than as a series of bars is also a plus, though not critical. One can also use "replay" and set it for a multiple of normal speed, e.g., 10x.

2. No. Regardless of the claims that are made, no.
1a: Well I was really just wondering if analysing P/V by looking at what is really a "hindsight" chart is valid, since one can't really tell where the bulk of the trading activity really took place but rather simply the sum total of that activity. Seemed the general idea of the thread is that this type of analysis was more relevant for real time than EOD so I was wondering if I was missing something about the analysis needed for EOD. Since your's and Brambles replies indicate that it is just as valid EOD, that is really all I need to know.

1b: Good idea, I will do that.

2: Bummer :(

Cheers,
PKFFW
 
PKFFW said:
1a: Well I was really just wondering if analysing P/V by looking at what is really a "hindsight" chart is valid, since one can't really tell where the bulk of the trading activity really took place but rather simply the sum total of that activity. Seemed the general idea of the thread is that this type of analysis was more relevant for real time than EOD so I was wondering if I was missing something about the analysis needed for EOD.

You're making a distinction between "real time" and EOD that I don't understand. EOD charts are just as "real time" as tick charts if they are what you're using to make a trading decision for the next day (or week, if using weekly charts). Hindsight is hindsight, and a completed "bar" is a completed bar, regardless of whether the bar represents a day or 15m.

I'm not yet sure what you mean by PV "analysis". The point of this analysis is to determine what it is that traders are doing, not what they're going to do. In this regard, the time interval and timeframe you choose to look at is pretty much irrelevant.

You may be interested in another thread I started to illustrate how to plot S/R (http://www.trade2win.com/boards/showthread.php?t=20336). You should notice that the principles are the same regardless of the time interval one chooses to chart.
 
Last edited:
I spose I hadn't thought of it that way. A bar is a bar regardless of the timeframe it represents.

What I mean by pv analysis is studying the p/v to determine what has gone before in order to be aware and ready to take advantage of potential turning points in price. Maybe I am missing something but it seems pointless to study the p/v solely to know what traders are doing right now in the present. If it does not serve to aid one in making a trading decision then it serves no useful practical function. A trading decision as I see it is an educated guess on which direction the price is likely to go in the future and determining if one wants to take action based on that likely scenario.

For example, you mentioned earlier in the thread about the amount of trading activity at any given price point. How if one has determined a likely area of support but there is not much trading activity at that price point then that calls into question the validity of the support. So hence by analysing the p/v relationship as it nears and hits that price point we can be ready to take advantage of any scenario that arises. If there is no increase in trading activity and price gradually falls through that level then we know it is not valid support and could perhaps pass on the trade. If trading activity increases and price rebounds then we could conclude that buying power has overwhelmed selling power and that level of support is valid, hence we may wish to take advantage of that set up. Either way, we are attempting to gather information, analyse that info, form an opinion and possibly take action based on that opinion.

Or am I missing something?
 
No, I don't think you're missing anything. But you're not likely to be able to nail any of this until you get down to it. I suggest you open up a journal and begin analyzing real charts of real stocks (or whatever) and evaluating the results. I know plenty of people who continue to avoid this step because they're waiting for some sort of sign or something. But there's no substitute for the doing.
 
Couldn't agree more. I'm going through the journal thread that used to be linked in your sig to get an understanding of what a journal should incorporate. In the meantime I've been watching charts and trying things out ever since I started reading this thread just to get familiar with the ideas.

Time to get down to the nitty gritty now and start recording my thoughts, ideas and conclusions so I can go back over them in time and analyse the results!

Cheers,
PKFFW
 
See these two threads. The first is for the journal, the second is for the images, tho they will be combined at some point. The advantage to using the "journal" thread for the text entries is that the comments are on a separate track.

http://www.trade2win.com/boards/journal.php?

http://www.trade2win.com/boards/forumdisplay.php?f=164

You may also be interested in the following journal:

http://www.trade2win.com/boards/showthread.php?t=20035

It's not a recipe, but it may give you some idea of how at least one trader has gone about the process.
 
Last edited:
my very loose transcript of a Tom W's interview

Any comments on the following?

Wyckoff principles are not easily explained by Wyckoff.

Markets are manipulated often.

The average person knows little about volume. The average person only think of maybe averaging volume, looks maybe at divergence, maybe look at buyers volume and sellers volume. But these really does not mean anything. All these things the average person knows has many flaws in them.

According to Tom (who trades according to things he discovered about Wyckoff):
Wyckoff principle boils down to three things:
1) All volume is, is the amount of professional activity that is taking place. You don’t any fancy indicators to see this when looking at volume. You can easily see if professional money has been active or not active on a particular bar.
2) Volume is closely link to market movement. What did market do on this particular volume movement?
a) did prices shoot up and close on a low
b) did prices shoot up and close on a high
c) did it gap up, closing at middle or low
d) did it fall on the volume
e) etc.
This will give a clear indication of the supply and demand present at this point in time.
Volume is simple to analyze. Volume is the amount of professional interest in the market at that time.
3) Supply and demand. For every buyer there has to be a seller, for every seller there has to be a buyer. If we think deeper: If there are more buyers than sellers, the market is going to go up. If there are more sellers than buyers, the market is going to go down. Even then we have to dig deeper: The market shoots off in the opposite direction that you think it is going to go. The reasons for this is: To stop a falling market, any falling market, demand has got to be seen to have overcome supply that caused the falling market in the first place.
In other words: High volume, market closed to the middle or high, with narrow spreads, something has capped the bottom end of the market, showing professional money has stepped into the market, and has overcome the supply, at the end of the day there are more buyers than sellers. If there are more buyers than sellers, the market is going to go up.

People are usually mislead because the market is plummeting down and the news is bad. People are then fearful and dump there shares. But this is exactly when the market will turn producing a Hammer signal with high volume.

The same thing will happen at the top of a market: What will stop a bull market rally, is that supply has to be seen to have overcome demand that caused the up move in the first place. That will mean very high volume on that bar, spreads will probably narrow and markets will close in the middle or low, you will immediately know especially if it is in new high ground, the professional traders have stepped into the market, dumped massive amounts of stock all to the ever eager buyers.
 
Trader2Win said:
Any comments on the following?

Have you read this thread by any chance (I assume you're asking if what Williams says is accurate and not if you've summarized an interview correctly)?
 
Last edited:
Trader2win,

This indeed appears to be an accurate representation of what Tom says.

His use of the phrase 'more buyers than sellers' is not correct (its impossible), but I know what he means.

His 'big thing' is 'volume shows professional activity', based on the reasoning that any other activity is so minor it doesn't really register in the volume figures.

But in many cases, big volume occurs as stops are triggered when prices shoot through support and resistance...Tom never looks at support and resistance, instead looks at trend channels for context.

In my view, Tom's analysis of the spread of a bar is the best I've seen to understand the balance between demand and supply...and the story it tells.

FWIW,

Porks
 
People are usually mislead because the market is plummeting down and the news is bad. People are then fearful and dump there shares. But this is exactly when the market will turn producing a Hammer signal with high volume.

if only :cheesy:
 
dbphoenix said:
Have you read this thread by any chance (I assume you're asking if what Williams says is accurate and not if you've summarized an interview correctly)?

Yes, I have read the best parts (about 40%) and made a few scrapbooks to analyse at some stage.

What does he mean by "more buyers than sellers"? Maybe he is talking about the moments before the trading takes place. There are more buying interest than selling interest (and therefore more potential buyers than sellers for yesterday's price). Then the trading for the day starts and price moves to create equalibrium between buyers and sellers. Then we have one buyer for one seller?

Trader2Win
 
Trader2Win said:
What does he mean by "more buyers than sellers"? Maybe he is talking about the moments before the trading takes place. There are more buying interest than selling interest (and therefore more potential buyers than sellers for yesterday's price). Then the trading for the day starts and price moves to create equilibrium between buyers and sellers. Then we have one buyer for one seller?
It's a convenient model to assume there is a specific buyer for each specific seller, but in reality the whole process, especially with Direct Access and ECNs is an aggregation.

However, the overall effect can be conveniently analysed as either being roughly in equilibrium, supply overrides demand (selling pressure) or demand overrides supply (buying pressure).

To suggest equilibrium doesn't exist in reality for too long a period of time ever is probably correct, but it also offers a significant opportunity to assess the likely next phase of the cycle.
 
Trader2Win said:
Yes, I have read the best parts (about 40%) and made a few scrapbooks to analyse at some stage.

What does he mean by "more buyers than sellers"? Maybe he is talking about the moments before the trading takes place. There are more buying interest than selling interest (and therefore more potential buyers than sellers for yesterday's price). Then the trading for the day starts and price moves to create equalibrium between buyers and sellers. Then we have one buyer for one seller?

Trader2Win

I wanted to clarify your question because, while I can explain further what I've said here, I can't do the same for an interview I haven't seen.

Since people change their views regarding market dynamics over time, and since you are asking about Williams' views (I don't call him "Tom" as we've never met) as expressed in a particular interview, can you post the interview so that we're on the same page?

Or, if you are interested in the forces that move price, independent of what Williams thinks about the subject, perhaps with regard to something that's been said in this or related threads (preferably a specific post you can refer to), we can go on from there.
 
Top