You are using an out of date browser. It may not display this or other websites correctly.
You should upgrade or use an alternative browser.
You should upgrade or use an alternative browser.
Price, (Volume), Support, Resistance, Demand, Supply . . .
Im asking again I would like to see a chart. where volume have help you get in to the YM or S&P?.Traders get to wrapped up in volume. Im my opinion you don't need volume if you scalping the YM or S&P for small amount of points sometimes volume can confuses you.
I look at volume but its not my number one tool for making a trading decision. I like looking at other markets in relation to one another. It all about understanding weakness and strength in relation to other markets.You will never know who the big players are, when it comes to volume it wont show up on the mini YM and the mini S&P.the big numbers are still played out in the pits. The only way to know what the commercials are doing is stand in the s&p pit How can you tell whether the big commercials and arbs are moving the market? Just look at volatility on the day You also want to take note of the direction of the market
Strength or weakness in the Dow transportation index, when you have discrepancy in the two, the divergence pinpoints strength or weakness-generally in the direction of the transport.I also look at the bond market for clues Also look for, if the Dow or s&p takes hours to rally say 60 points and then it sells of 40 points in about 5 mins or so. That kind of explosive burst is important because it indicates that the market has touched the highs of the day. On the slow breaks the market will generally regain strength and move higher
When you see the spike its time to position yourself for the move to come. A lot of traders miss the mark at this point because they don't understand what's happening. as the public so called indictors say not ready yet, then when they all line up. Its time for pro traders to get out.
I use volume different form most of you. I like see heavy volume at the end of a move, I then trade the opposite of everyone else.
CJ
dbphoenix
Guest Author
- Messages
- 6,954
- Likes
- 1,266
Your earlier post said nothing about a chart, and there's no need to repeat everything. We understand your point.
If you'd like to see charts, there are dozens available here and on my old ET threads. If these are somehow unsatisfactory, state why and perhaps we can move on from there.
--Db
If you'd like to see charts, there are dozens available here and on my old ET threads. If these are somehow unsatisfactory, state why and perhaps we can move on from there.
--Db
Volume needs allocation to different timeframes. Never try to make up your own timeframe, always adhere to market time? Sounds obvious or crazy? 'Professional volume' has 'professional money management', think about it? Volume wise, don't just try and fit yourself in any old how. Can you afford your time frame? Volume wise, the professionals do it all the time. To fully understand volume you need to understand professional money management about price. RUDEBOY.
dbphoenix
Guest Author
- Messages
- 6,954
- Likes
- 1,266
aricho said:any charts anyone?
See the "Weekly Chart" for July 26 at Pristine.com.
erierambler
Well-known member
- Messages
- 265
- Likes
- 8
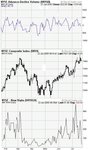
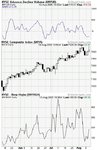
dbphoenix said:Just for the record (see last week's post on the Nasdaq), the NYSE is clearly more neutral:
Yes and the divergence is still there for the Nasdaq and the Nyse, regarding the highs and Avdvd.
erie
dbphoenix
Guest Author
- Messages
- 6,954
- Likes
- 1,266
erierambler said:Yes and the divergence is still there for the Nasdaq and the Nyse, regarding the highs and Avdvd.
erie
Actually, there is a divergence there now that wasn't there for the NYSE, and the divergence for the Naz is considerably more negative.
We'll see.
--Db
Hi DB!....
hi Db,
How can i get the weekly charts on pristine?.
i see the DIVERGENCIEs in the adv-dev volumes on the both the COMPQ and NYA.And also NEW highs.But it seems you are reading it as NEUTRAL?.
On another note i have been following you from ELite and like all your market insights.
I also bought ($180) the wyckoff course from GARY FULLET Site.
i am trying to follow the Naud , Compq, Nahgh and NYA,NYUD,NYHGH to see the divergencies.
I have found the divergences two times in the last 10 months and both the times market made a intermediate turns.
I have few questions on wyckoff principles.
1.Do you think the wykcoff principles still work?.I also read from you and others that the volume
on stock indeces is tough to read.Is it better to look at the FUTURES volume?.
2. Do you suggest any other site or chart to look at the market direction.
Thank you so much for your Help.
Regards
Bkr
dbphoenix said:See the "Weekly Chart" for July 26 at Pristine.com.
hi Db,
How can i get the weekly charts on pristine?.
i see the DIVERGENCIEs in the adv-dev volumes on the both the COMPQ and NYA.And also NEW highs.But it seems you are reading it as NEUTRAL?.
On another note i have been following you from ELite and like all your market insights.
I also bought ($180) the wyckoff course from GARY FULLET Site.
i am trying to follow the Naud , Compq, Nahgh and NYA,NYUD,NYHGH to see the divergencies.
I have found the divergences two times in the last 10 months and both the times market made a intermediate turns.
I have few questions on wyckoff principles.
1.Do you think the wykcoff principles still work?.I also read from you and others that the volume
on stock indeces is tough to read.Is it better to look at the FUTURES volume?.
2. Do you suggest any other site or chart to look at the market direction.
Thank you so much for your Help.
Regards
Bkr
Attachments
erierambler
Well-known member
- Messages
- 265
- Likes
- 8
bkr said:hi Db,
How can i get the weekly charts on pristine?.
Bkr
Just go to Pristine.com and sign up for free and then go to chart of the week. If you allow them to send you emails ,you will receive the chart and lesson of the week .
erie
Thank You Erie
I did go there but didn't realise that you guys are talking abt QQQQ's.
I have read that article and makes sense like any other article when you look at that point of time.
I was impressed when i read wcykoff that without the VOLUME you are really blind.But it seems
it also makes just to look at the price action as well.
Please let me know anyone has taken the Pristine Seminars and what do you think abt it.
Thank You all
dbphoenix said:Actually, there is a divergence there now that wasn't there for the NYSE, and the divergence for the Naz is considerably more negative.
We'll see.
--Db
Divergence and the Accumulation/Distribution indicator, which is associated with volume.
I wonder how many charts there are, as a percentage of the total, that have examples of convincing divergence occurrences. Depressingly few, I feel.
Take this example of BAA, which has been showing divergence since August of last year and what about BHP Billington (BLT), which is showing divergence right now?
Split
Attachments
dbphoenix
Guest Author
- Messages
- 6,954
- Likes
- 1,266
That's the problem with indicators, and why they aren't a subject of the thread. New highs and the volume of advancers and decliners aren't nearly as removed. Rather than look at something "associated" with volume, look at the volume itself.
--Db
--Db
dbphoenix
Guest Author
- Messages
- 6,954
- Likes
- 1,266
dbphoenix
Guest Author
- Messages
- 6,954
- Likes
- 1,266
For those who are keeping a scrapbook, the following is related to a recent post on the matter:
http://www.trade2win.com/boards/showpost.php?p=192589
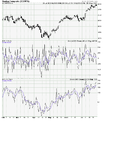
Note that when the NQ begins to fall out of its hinge, the ES and YM have already made at least one lower high using this bar interval, thus affecting the probability of success for the trade:
http://www.trade2win.com/boards/showpost.php?p=192589
Note that when the NQ begins to fall out of its hinge, the ES and YM have already made at least one lower high using this bar interval, thus affecting the probability of success for the trade:
Attachments
Similar threads
- Replies
- 11
- Views
- 8K
- Locked
- Replies
- 54
- Views
- 26K
- Replies
- 0
- Views
- 4K