JumpOff
1
- Messages
- 702
- Likes
- 14
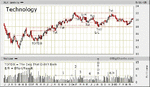
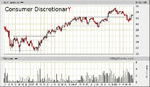
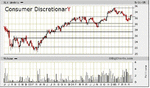
dbphoenix said:6., 7., 8 . . . ?
The last week of Feb shows one more thrust at R @ 31.5, but there aren't enough new buyers to offset the sellers..Price kisses R and slides down lower volume ending near the low of the bar.
6. First week of March 05, vol as big as the 4th week of Dec, and sometime during the week, there was another buying run @ R, but the selling pressure was greater than the buying pressure and the price closed lower, again near the low of the bar.
The second week of march brings a smaller bar, a down doji, with lower vol, owners may have even had a moment to hope the fall was slowing, will it finish falling?
The third week of march shows a further slide again on higher vol. Long term owners who have been tracking the demand line for momentum watch closely as price approaches it.
The First week of April shows a doji, on lower volume - so the price was in a base most of the week.
Second week of April, there was on last push at the top of that base but no breakthrough and the price plummets with strong volume until it finds some buying pressure again near an area that was resistance through the majority of 04. *Long term owners and potential shorters have both noticed that the price made a LowerLow, broke the long term demand (trend) line, and are getting their ducks in a row to unload if price doesn't make a new high with good volume.
Third week of April, volume increases and buying pressure takes price to about 29.5, - but there is no follow through, and although it's an "up" bar, it's not an "up" sign. Even with that extra volume, the price does not close at the high, but sags back to the middle of the bar.
7. Fourth week of April, stronger volume again, and a lot of folks are changing their positions. It an inside bar and neither side out-pressures the other the price ends a little higher than the last bar, but well off the high.
Last week of April, another inside week (general agreement amount prices for the moment) and lower volume. The bottom of the bar lifts, and technically its an "up" bar, but it's not a strong "up" sign, there is no newer high, and volume is low. A daily or hourly chart would show another base. Those who know how to unload quietly at the top of the base without spooking the herd are doing so now.
First week of May. One of the daily charts for this week would show a "failed poke" above the base. The price has fallen through the bottom of the base and has found some supporting buying pressure because it closed off the bottom. Probably all this activity at the highest price in several years has attracted "those who wait until it's a sure thing" (aka those who usually get burned at the top). Their buying stops the fall of the first week of may (see the volume come in?) and at 8 there is an up bozo that is almost as big as that down bozo from 5 bars ago. Almost. But look at the volume while this is happening - it takes a huge number of transactions to make the price go up, and the price doesn't clear the high of the down bozo that had half the volume.
Second week of may, there is one more push up, but the sellers are beginning to relax their shoulders and smile a little when they cover their mouths. Long term owners are making plans to take their profits (if they haven't already done so during the doji-bases) or considering whether they want to withstand a long term serious 'retracement'. 😉 Looks like 70%+ of those who bought since Nov. of 04 are already underwater.
The last little doji doesn't seem to have a volume bar?
JO
I'm reposting the image here for ease of viewing.
Last edited: