JumpOff said:
Ok- Early on in this thread I thought you were talking about how important volume is, because it is the volume of buying and selling pressure that cause price movement.
Are you saying that after gaining a certain amount of familiarity with real time trading, you can pretty much tell what's going on with volume, just by the ways the bars are forming? By looking at a chart you can "know what kind of volume" was behind it - the way a tracker can look at tracks in the sand and say, "the dog was trotting along looking left at this point, then it stopped here, then sprang forward here and pounced."
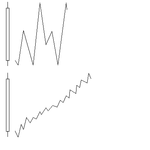
Are we getting to plain old pure price action...?
JO
You're asking several questions.
Yes, volume is important. But the volume bar is siimply a way of illustrating volume action. What's important is the volume itself, not what's used to represent it, just as what is important about price is the price action, not the bar interval chosen.
And, yes, you can get a pretty good idea of what's going on with volume by the way the bars are forming, but not of course in hindsight. That's the difference in watching them form and reviewing a static display. EOD traders, of course, don't have the luxury of watching them form, so they require some sort of representation of volume such as the volume bar. A gardener has a different appreciation of a rose than someone who buys one at a stall.
And one can eventually get to plain ol' price action, if one is watching it in real time, but since volume of some sort is required to move price, it helps to understand the nature of volume. One can also admire a car in motion, but in order to understand why it does what it does, one must know something of the accelerator and the brake and the effects of inclines and declines, as well as abrupt encounters with immovable objects.
Trying to interpret price in hindsight without volume is possible, but one is working with a handicap, like beating egg whites with a knife.