firewalker99 said:
I know people are saying look at the big picture, look at the forest instead of the trees.
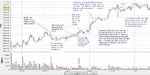
But the books I've read (amongst others) from Tom Williams - VSA all really point out one specific bar (on any time frame, even 3 or 5 minutes) and than give some meaning to it. Let me give you an example of how I put VSA in practice and seem to get it all wrong three to four times.
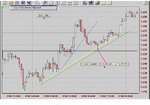
Yes, I know with the chart included (Russell 2000, intraday 3 minute of August 3) it's an uptrend. Well then if I should not short, where should I go long then? Each point you'd indicate would mean going long at the high, don't they say "sell high, buy low"... instead by going long I'd by buying at an increasingly higher level...
Having read some of the comments of DB on your Journal, I am afraid he is spot ont, looks like you are having the same problem as most have in the initial stages of their trading career,
namely a Kitchen Sink Approach, trying to combine everything, S/R, Trendlines, VSA, Point and figure, Market Profile, Gann, Fib levels, etc, having gone through that experience all I can say is one end's up like a dog chasing his tail.
1. Came across Candlestick charting during my stockmarket days in 1993, thought I had found the treasure to forecast every twist and turn in the market with those Hammers, Dragonflies, Shooting stars, Gravestone Doji, Engulfing bars etc Took a long time to learn that these have to be considered within the context of the Price action and not in isolation.Bet majority have gone down that route. Steve Nisson has made a career out of it, if he had unearthed some secrets allowing vision into the future, he would now own a few Islands in the Pacific and surpass Bill Gates in wealth
2. When I landed on to VSA in 1999, initially made the same mistake, reading into every bar , that is what is happening to you at present, Just reading a book and trying to understand in totality the underlying pulse of the market is a futile endeavour, it has taken nearly 5yrs to gain more insight into VSA concepts, so give yourself time, you are on the right track
3. Think Db's suggestions are the best you will ever get, his strategies revolving around S/R and Trendlines are the most logical presented and explained with lucidity I have not found on any of the Journal or threads, would be nice if now and then he showed examples of his own SWING (Golf jargon)
🙂)
keep it simple, focus only on a couple of time frames, 60min, 5min, mark those imp. S/R levels,
As I mentioned previously establish the trend on the longer time frame first. then you can trend with it on the smaller time frame, also keeping in mind that a Retracement on 60min chart can exhibit itself as a Trend Reversal on the 5min chart with its own series of retracements.
Hope this helps