Price, (Volume), Support, Resistance, Demand, Supply . . .

dbphoenix said:
Any website that provides financial information on stocks, e.g., Yahoo.

Please excuse my persistence.

Is the float the total number of shares issued by a company ?
I can find this on Yahoo but cannot find anything under 'float'

Regards

bracke
 
Bracke - Yes, it is the total numebr of shares issued. Don't forget to subtract the number of insider held stock. What you are looking for is stocks where the daily volumes are expressed as higher percentages of the outstanding float. The more tightly held the stock, the more likely it is that a small change in demand will cause a bigger change in price.

Steve.
 
stevespray said:
Bracke - Yes, it is the total numebr of shares issued. Don't forget to subtract the number of insider held stock. What you are looking for is stocks where the daily volumes are expressed as higher percentages of the outstanding float. The more tightly held the stock, the more likely it is that a small change in demand will cause a bigger change in price.

Steve.

stevespray

Thank you for your answer. Now I understand.

Regards

bracke
 
OK, Maybe we should put forward some ideas for stock which looks like it might be being acumulated.

My first suggestion is DELL. Looking at daily chart we got a fairly tight consolidation with slightly lower volume. A couple of weeks ago we also got a push lower which was supported with good volume.

Any comments ?

Steve.
 
stevespray said:
OK, Maybe we should put forward some ideas for stock which looks like it might be being acumulated.

My first suggestion is DELL. Looking at daily chart we got a fairly tight consolidation with slightly lower volume. A couple of weeks ago we also got a push lower which was supported with good volume.

Any comments ?

Steve.

Perhaps "further" accumulation would be more accurate since this is a second-stage base. But since the downside has been rejected several times, the bias is to the upside, at least for now.
 
DBP.

As someone already asked, could you outline your trading style. Prehaps a few examples of what you are currently looking at.

At this point it might be good to introduce some 'live' examples into the thread. Too much theory and too little practical make for far less input from my experience.

Steve.
 
stevespray said:
DBP.

As someone already asked, could you outline your trading style. Prehaps a few examples of what you are currently looking at.

At this point it might be good to introduce some 'live' examples into the thread. Too much theory and too little practical make for far less input from my experience.

Steve.

My "trading style" is detailed in my "e-book". I buy low, sell high, employing breakout, reversal and retracement strategies. The basics are in the gratis pdfs available at my Yahoo site. It's all only a mouse-click or two away.

As for what I'm looking at, I'm looking only at the NQ now since I sold all my stocks last winter. As for today, I'm not trading at all since we're in chop. I may see something I like this afternoon, but I'm not holding my breath.

Edit: I should also point out, again, that what I do or don't do really doesn't matter since everybody has to find his own course. What matters is learning, understanding, and applying basic principles, which is the point of this thread.
 
Last edited:
Market

It was mentioned that S/R by proxy could be difficult, but here is some of what I look at. Volume on the NYSE is lighter today than on the 19th and 20th . The 19th has potential R and the 20th potential S.

erie
 

Attachments

  • Image2.gif
    Image2.gif
    14.9 KB · Views: 413
stevespray said:
OK, Maybe we should put forward some ideas for stock which looks like it might be being acumulated.

My first suggestion is DELL. .

No comments on my comments, so take a look at AMAT.
 
DBP.... Morning..

I'm looking at AMAT. What do you like about it ?

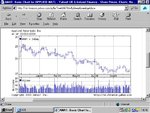
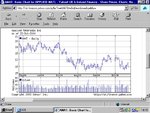
If you look at the Weekly chart back from mid April thru July then we had a possible accumulation phase but it broke to the downside of very heavy volume (looks like a news item). It hasnt recovered since.

Range currently $15.30 - $17.80 odd which is about 10% of overall value.

Would you be a buyer here or wait until a test below the $15.30 support ?

Steve.
 
I don't have any feelings about it one way or the other, but I do notice two sets of rectangles beginning last April. Since volume has yet to decline, I wouldn't call this or the previous rectangle "accumulation", but rectangles are easy to play.

Since I trade breakouts, reversals, and retracements, there's no reason to buy here.

Don't know what you mean by "overall value".
 
dbphoenix said:
No comments on my comments, so take a look at AMAT.

Thought the two charts 12 months and 6 months might be useful. See below

Can you explain "rectangles are easy to play"

Regards

bracke
 

Attachments

  • untitled.jpg
    untitled.jpg
    69.9 KB · Views: 474
  • untitled.jpg2.jpg
    untitled.jpg2.jpg
    71.3 KB · Views: 373
Last edited:
bracke said:
Can you explain "rectangles are easy to play"

Regards

bracke

In "Rectangles" at my site, I explained how to trade breakouts, retracements and reversals when playing this formation. Seems easy to me, anyway.
 
Last edited:
dbphoenix said:
In "Rectangles" at my site, I explained how to trade breakouts, retracements and reversals when playing this formation. Seems easy to me, anyway.

My apologies, I leaped before I looked.

I have your document on Rectangles but have not read it yet, still working through Supply and Demand.

Regards

bracke
 
DBP...

Would you say that you make money, on a regular basis, from the markets ? If it's a personal question then tell me to sod off !

I'm just interested in the reasons behind the thread. Is it to promote education or to improve your own personal trading performance.

wishes,
Steve.
 
The reasons for the thread can be found in the first post. I'm afraid I haven't learned anything new, but this is probably because so few people trade by price and most of the posts have been made by beginners who are interested in learning something about doing so. In fact, I thought the thread had run its course.

Perhaps you could clarify just what it is that you expect. I responded to your post about DELL and I answered your question about AMAT. I can't force anyone else to participate.
 
My previous suggestions regarding DELL was just to get the ball rolling with some proper 'live' reviewing of price and volume action. As I mentioned before, it's all well and good having lots of theory regarding points of entry and low risk etc but that is useless until folk are encouraged to actually try it. Then it becomes a whole different game - peoples posts and comments are then set in history.

My feeling is that this is a good thread. Sure, you feel that its run its course, thats your opinion and you're entitled to it. My feeling is that the thread can be taken quite abit further. This can only be done if people are prepared to apply some of the points which they feel that they have learned over the course of 400+ postings by all manner of people.

It's a natural progression - Learn something >>> Apply what you've learned.

What holds people back in these situations is fear, fear that they might be wrong or fear that they could be laughed at. This applies to both newbie and experienced traders alike. No one wants to risk damaging their 'appearence' by making a duff call. (Abbey Cohen aside of course).

Come on - lets encourage some real discussions on real charts which are in front of us now.

Steve.
 
stevespray said:
Sorry, I didnt mean to cause any offence by the asking the previous questions. It appears that I have. Let me say 'sorry' before it develops any further.

Steve.

You didn't cause any offense, but clearly things aren't going the way you expected them to, but since I don't know what you expected or expect, I don't know what to say to you. If you want to discuss stocks or futures or whatever and post charts and comment on S/R and/or price movement or whatever and/or ask for comments on same, that's fine. But I can't force people to respond. So far, there's been little comment on erie's charts, and there's been no further comment on DELL. If nobody's interested, then nobody's interested.

I suppose I could post annotated charts, but I've already posted dozens and that wouldn't do me any good, and I doubt that doing even more would do anybody else any good either. At some point, one just has to put pencil to paper (or cursor to screen) and do it, e.g., the comments I made to babymush on his S/R chart. I'm not going to do it for him, and nobody else should either. Whether he does it himself or not is beyond my control.
 
This is the first I've heard of the rectangles document. I am eager to read it. I have been to your site: http://finance.groups.yahoo.com/group/DbPhoenix/ and have signed up as a group member. However I do not see the word "rectangles" anywhere, and searching the archives using that keyword gets a response of "zero" found.

If you have a moment, will you post a link to it's location, or upload it here?

Thanks in advance, JO.

Also, re: this thread running it's course. - I thought it was just getting started! Posting naturally slows a bit the longer a thread gets. New comers often want to read the whole thing before they post, and those following along from the beginning either tend to lose interest or become more reflective as they digest the material.
 
Top