Technical Analysis Price Action Forex Trading

  • What is price action?

Price action is the behavior of the price of a specific currency, commodity, stock, or other security over a specific period of time. All financial markets display the price movement of a security over varying periods of time on price charts. The price action on a price chart reflects the aggregate belief of all market participants about the value of a security’s price during the specified period of time reflected by the price chart.

Price action analysis allows you to see exactly what is happening in any given market at any given time because price action is the visual trail of the supply and demand situation of the given trading instrument over a specified period of time. A chart’s natural price action reflects the expectations and beliefs of all market players; the bigger more informed players obviously leave a more noticeable trail, so by analyzing the behavior of price over a specified period of time we can make an educated guess as to what those “in the know” are doing in the markets.
  • Trading Forex with price action strategies

Forex trading with price action is the application of price action analysis to the forex market, or more specifically, to a forex currency pair. Essentially, what this means is that you can use simple price action setups to trade the Forex market, you do not need to use indicators or trading software because the market generates its own entry signals via price action. Certain price patterns re-occur in the markets and can be used to develop a high-probability trading system or strategy. Price action setups can be used to trade any financial market; however the forex market has the deepest liquidity and lowest startup costs as well as widest accessibility of any financial market, for these reasons and more it is the most popular market today among retail traders.
  • Why trade the forex market with price action vs. other methods?

Price action trading has many advantages over most other methods and virtually no disadvantages. When you trade the forex market with a “clean” or indicator-free price chart, you are getting an uninhibited view of the movement of a currency pair’s price action. This is in direct opposition to many indicator-laden trading systems and strategies that essentially cover up the most important data that a market provides; price action. Having this uninhibited view of a currency pair’s price action allows you to make clear and accurate decisions about the possible future direction of a particular forex currency pair via price action setups, or patterns.

Price action setups and patterns give you an easily recognizable and high-probability edge due to the repetitive behavior of the forex market; this edge is clean, logical, and less haphazard than any other trading edge out there. Once you properly learn how to spot and trade price action setups, you will develop a refined market perspective that will allow you to trade the market only at the times you see a high probability price action setup present. Viewing the forex market from this clear and logical perspective also works to positively influence your trading psychology by keeping your charts and your mind clear and uncluttered from any unnecessary or overly-complicated indicators or trading software.
  • Price action is the foundation for all technical analysis.

The ability to interpret price action; the dynamics of a market’s price movement, is necessary to correctly understand all forms of technical analysis and improves your ability to utilize them. Essentially, price action analysis is the foundation which you should build your understanding of technical analysis upon because the movement of a security’s price over time is the single most important piece of information in any financial market, and it is also the information from which every other form of technical analysis is derived.

Trading the forex market, or any market, with simple price action analysis, allows you to accurately enter into trending markets, consolidating markets, quite or volatile markets. It is this flexibility of price action, combined with the fact that it is a clear and logical trading strategy which makes use of first-hand market data (price), instead of second-hand data (indicators), that makes price action analysis a widely traded strategy by professional traders and institutions all over the world.
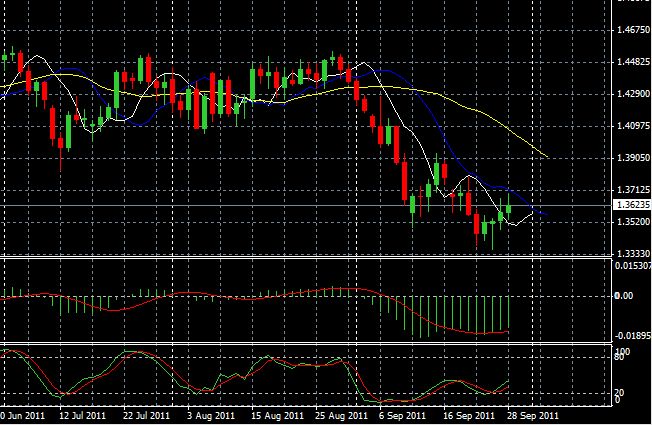
  • Price action trading is clear and not messy or confusing

Here’s an example of what I consider a “messy” indicator-ridden chart:

image1-217.jpg


Here’s an example of a clean price action – only chart:

image2-180.jpg


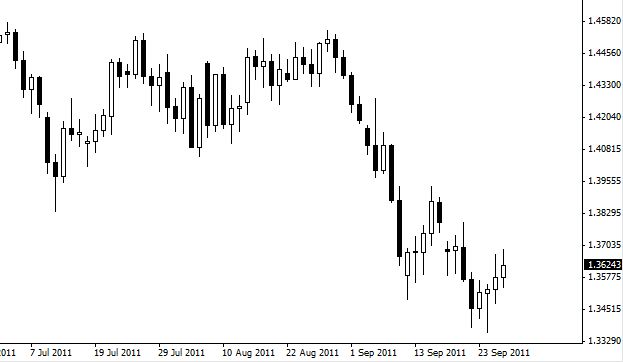
It’s clear that the price action only chart is easier to look at and thus easier to read and interpret. There is just no reason to trade with messy charts when you can trade with clean and clear price-only charts.
  • How can understanding price action trading help you become a better trader?

Understanding how to trade the Forex market with price action can help you become a better trader because you will know how to read and trade the natural price dynamics of the market. Once you understand how to read and trade the natural price dynamics, or price action of a market, you will have a solid foundation on which you can build an effective trading strategy. No matter what trading strategy or system you end up implementing, knowing how to read and trade off the natural price action of the market is only going to make it more effective.

Most successful traders have developed their discretionary price action trading skill at least to some degree of proficiency. This is because no matter what you read on the internet or elsewhere, you have to know how to read a market based on its price movement, and interpreting and using price movement is not an exact science, no matter how much certain Forex “robot” system sellers want you to believe it is. Thus, by learning how to trade simple price action strategies in the market, you will be developing your discretionary price movement analysis skills, and these skills will improve your overall understanding of how markets ebb and flow and when the best time to enter and exit them is.

Once you are armed with the knowledge of how to read and utilize the raw price action of a market, you will be able to directly apply it to your Forex trading strategy, or you can simply trade price action as a stand-alone method. Indeed, many traders end up gravitating towards raw price action trading once they become exhausted from trying to trade messy indicator-based methods that seem more confusing than anything else. It’s a good idea to get started learning about simple price action trading concepts today if you don’t already have a solid understanding of them.

Nial Fuller can be contacted at Learn To Trade Forex
 
Last edited by a moderator:
It would be easier if T2win had a section for proven mentors who trade what they teach. While they never prove themselves they can always have a good following as they are just teaching what can be found anywhere. Having said that its a lot harder to call live than to forecast, different emotions entirely. Its amazing how good a rep someone like Nial has, just like the bully at school,the reputation is all that's needed,never has to fight
 
I got to the end of page 2 and expected the "next page" button to show me page 3.

Is that all there is without giving him the chance to worm his way into my email?
 
Come on, Richard, don't build this up into a weekend debate!

Let's go back to the UK going to the dogs, the EU going to China or the price of US stocks these days. :D

Since those nasty Euro members won't let us dictate euro policy, President Cameron and Vice-President Cleggover are applying for us to be the 51st State of the Union and soon we won't have to worry about the £ as we will be in $$$ (tough s**t Scotland, you wanted to be rid of us :LOL: ) The Americans can then get their hands on BP and Splitlink can finally leave Spain and return to our rainy shores.
The Chinese will be exporting opium to Europe so the latter can forget all their troubles and pack them up in an old kit bag.
US stocks will attract further funds long term (as will US Treasuries as Euro ones are pretty worthless ) as who wants to buy Euro stocks that are all owned by a Red Chinese regime - though the EU was going communist anyhow.
Oh yeah, China will soon get rid of that Human Rights Court nonsense.
Anybody got any of those worthless CDSs in sovereign debt left under the bed? Use them for loo paper.
 
Price Action does NOT include time....

Price action is the current price per unit volumn, not per unit of time. Time charts actually add 'noise' to a chart. Pure price action does not care what time it is.
 
Price action has nothing to do with time. Price action is current price per unit volume. Time charts, while very popular, are actually the worst charts to use for price action. Tick charts were better, but true volume-bar charts (with real capping) would be the best for visual representation of price action. MultiCharts is the only charting program that I know that has this built in. But for the forex market, volume is very tricky to calculate without true level II data from your broker.

There will be an indicator released soon that helps measure price action in real-time by auto-drawing fibonacci retracement tool. I'll keep you posted or you can follow up at Always-winning automated money machines for metatrader 4/5
 
Price action is the current price per unit volumn, not per unit of time. Time charts actually add 'noise' to a chart. Pure price action does not care what time it is.

Price action has nothing to do with time. Price action is current price per unit volume. Time charts, while very popular, are actually the worst charts to use for price action. Tick charts were better, but true volume-bar charts (with real capping) would be the best for visual representation of price action. MultiCharts is the only charting program that I know that has this built in. But for the forex market, volume is very tricky to calculate without true level II data from your broker.

There will be an indicator released soon that helps measure price action in real-time by auto-drawing fibonacci retracement tool. I'll keep you posted or you can follow up at

so that readers aren't too confused by this opinion of fibonacci and price action.....they are not correlated and they are unique to themselves in their properties.....fibonacci is the measure of printed price extremes and do not unfurl or assist the trader to understand or interpret the underlying price action, secondly, fibonacci measures are static once applied and all fibonacci measures, while not being fluid, are active at all times so one can not be sure that any one measure is a defintive extent or a dominant extent, whereas, price action is a fluid activity with no actual end-point (for 24 hr futures) and one can read price action whereas any end-point measure is inviting the trader to rely on black box type thinking while the underlying pricing is governed by time.....to seperate and ignore time as critical factor is, frankly, dumb! Afterall, if youre going to give fibonacci any validity on price then how is it less valid when applied to time? That's heading off into pedantic land.......my point is; to seperate and disregard time, as a fluid component of the underlying price action, is to disregard that cash markets have an opening/closing requirement, that money managers have a higher activity rate in some quarters or months than others, or, that options activity brings other players to the table, or, that the traders who play at lunch time are different to the players on either side, or, holidays, seasonalities yadda yadda ....so, the opinion that "price action has nothing to do with time" is questionable.....btw, tick charts simply offer more viewing room, they offer more data to be read and interpreted.....that does not mean that a trader can read a tick chart any better than they can a 5 second or 15 min chart.....you either understand what is happening as price moves or you do not.....if that is true, then, surely, time remains critical.....i am dubious that you are being told to ignore time but instead add on a add-hoc (until printed) fibonacci.....remember, for fibonacci to have any validity or for you take any action you are required to interpret the validity of the occurrence and you are required to judge the weight of that measure in its implications for further price movement thus you need to look at what? Yes, price action.....is that the cart before the horse.....anyways.....the question is not whether there is any validity to fibonaccis or not, the question is; do you understand what is going on behind the price action and the time it is occurring......and one more thing about volume as a key component; dont be fooled by the volume is everything crowd or you'll run around in huge circles trying to find the best software to interpret and give you signals about volume......a 10k volume bar has different implications to a 1.5 million volume bar, but, all in context and a volume bar cannot interpret the context for you volume bars only alert you to history not the bar that you'll be trading.......volume bars make up the left hand side of the reading whereas youre trading the right-hand and unkown side of the chart.......

"price action" is, of itself, a misnomer....pricing that occurrs in the next moment, which is where you'll be trading, has not yet printed, so, whether you consider one form of printed evidence (chart) over another to have any more relevance, or not, as you have been taught, is frankly irrelevant to the next trade if you say that price action is active


as soon as any measure, straight, curved or fitted is placed on price then you have instantly veered away from price action itself into left field and you are forcing yourself to not think about the unfurling action but to think of a linear impression of price.......

ideas.....things to think on
 
Last edited:
so that readers aren't too confused by this opinion of fibonacci and price action.....they are not correlated and they are unique to themselves in their properties.....fibonacci is the measure of printed price extremes and do not unfurl or assist the trader to understand or interpret the underlying price action, secondly, fibonacci measures are static once applied and all fibonacci measures, while not being fluid, are active at all times so one can not be sure that any one measure is a defintive extent or a dominant extent, whereas, price action is a fluid activity with no actual end-point (for 24 hr futures) and one can read price action whereas any end-point measure is inviting the trader to rely on black box type thinking while the underlying pricing is governed by time.....to seperate and ignore time as critical factor is, frankly, dumb! Afterall, if youre going to give fibonacci any validity on price then how is it less valid when applied to time? That's heading off into pedantic land.......my point is; to seperate and disregard time, as a fluid component of the underlying price action, is to disregard that cash markets have an opening/closing requirement, that money managers have a higher activity rate in some quarters or months than others, or, that options activity brings other players to the table, or, that the traders who play at lunch time are different to the players on either side, or, holidays, seasonalities yadda yadda ....so, the opinion that "price action has nothing to do with time" is questionable.....btw, tick charts simply offer more viewing room, they offer more data to be read and interpreted.....that does not mean that a trader can read a tick chart any better than they can a 5 second or 15 min chart.....you either understand what is happening as price moves or you do not.....if that is true, then, surely, time remains critical.....i am dubious that you are being told to ignore time but instead add on a add-hoc (until printed) fibonacci.....remember, for fibonacci to have any validity or for you take any action you are required to interpret the validity of the occurrence and you are required to judge the weight of that measure in its implications for further price movement thus you need to look at what? Yes, price action.....is that the cart before the horse.....anyways.....the question is not whether there is any validity to fibonaccis or not, the question is; do you understand what is going on behind the price action and the time it is occurring......and one more thing about volume as a key component; dont be fooled by the volume is everything crowd or you'll run around in huge circles trying to find the best software to interpret and give you signals about volume......a 10k volume bar has different implications to a 1.5 million volume bar, but, all in context and a volume bar cannot interpret the context for you volume bars only alert you to history not the bar that you'll be trading.......volume bars make up the left hand side of the reading whereas youre trading the right-hand and unkown side of the chart.......

"price action" is, of itself, a misnomer....pricing that occurrs in the next moment, which is where you'll be trading, has not yet printed, so, whether you consider one form of printed evidence (chart) over another to have any more relevance, or not, as you have been taught, is frankly irrelevant to the next trade if you say that price action is active


as soon as any measure, straight, curved or fitted is placed on price then you have instantly veered away from price action itself into left field and you are forcing yourself to not think about the unfurling action but to think of a linear impression of price.......

ideas.....things to think on

The price action, as I see it, occurs in the present moment as a relationship between the current market price and the previous market price(s). The current price has 3 options: It is either less than, equal to, or greater than the previous price. There are no other options for price movement. It does not matter what time that price comes in. The price is whatever the market agreed it to be at that moment, and it can change at anytime. You could then further categorize the movement depending on the amount/distance change in price as an up-trend (higher highs and higher lows prices) or down-trend (Lower Highs and Lower Lows prices). Of course you could not confirm a trend until your are actually in the middle of one. Many people even try to predict the trend, but that's beyond the scope of this discussion. More importantly, once price has moved, a decision must be made on whether to enter/exit the market. This decision will be interpretive, but for maximum profitability, the decision would be consistent with the price movement.

Lets deal with how some types of charts can further skew perception of price action. Simple version: Price charts are just graphical representation of numbers (past prices and current price). Charts aren't even necessary; a spreadsheet could track price action. Longer version: Take futures for example. If you use time charts, you could have a 20 tick price range movement in 1 minute, followed by 100 tick range in minute 2, followed by 50 tick range in minute 3, followed by 0 tick range (shown as a '-' on chart) minute 4, etc. Often times you can display volume in a separate graph. Here is the problem(s). You have time consistency (each bar represents x minutes/hours/days), but the activity within the bar is what we are focused on. You are adding another dimension to the chart that the market price The high/lows and especially open/close of bars become arbitrary. You add noise to the actual price action, especially the lower the timeframe.

Then the broker's minute can be off from broker to broker, and especially as you increase the bar chart minute size. What is considered a "day". This is more minimal skewing in futures, but becomes more 'important' in forex and other off exchange products.

You could use tick charts, but there could be multiple volume on the same ticket (tick) (go long 50 contracts at 2345.50 would be one tick when filled). So initially it would be better than time based charts, but not too much.

If you use volume bar charts (with true capping/splicing) then the only bias is the # volume per bar the user picks. Only historical/current price and volume would be reflected in these type of graphs.

Funny thing is, the market already gives us price and volume in its data series (broker datafeed); so why add anything else to the core price unintentionally? It only makes the chart more noisy, subtlety adding unnecessary interpretations.

We use time or any part of the calendar for the purposes of keeping track of things for planning purposes....nothing more. News announcements, seasonal volatility, liquidity, etc are fundamental aspects of trading that can help offer an explanation as to why price action occurred the way it did (before the fact e.g prediction or after the fact e.g. commentary) or to assist a trader in determining if the current conditions are suitable for his risks. These are additional 'indicators' or interpretations of market behavior, but this does not affect the fundamental price. Only the entries/exits/volume of market participants who took action move the current price up or down.

The "fibonacci" tool that I was referring to shows the relationship between the current price and previous price. It simply shows price movement range that has not yet made an x% retracement. It's displaying a fact of the market action. It was designed to measure price action direction and you can use fibonacci #s to assist with that or whatever #s you want really. Most if not all fibonacci retracement tools are manually drawn tools and you would have to continuously adjust on the chart after the fact if the market continues in a particular trend. My custom tool auto-draws it for you in real time and can alert when a specific range length has been met. It is not lagging or leading in my opinion, although the fact that it doesn't lag would probably make it a leader in comparison with, say, a moving average. And with automation, you can do much more than you could do manually.

Furthermore, any tool is completely useless unless used as a part of a system. Similar to how your liver, while it has important functions is useless outside of your body, or an alternator of an engine....important, but useless without the rest of the engine, wheels, and frame to make up a complete system. Again, outside the scope of the topic here, but it does tie into making a trading decision, as the price movement itself is worthless without a method to consistently determine entry/exit to act (or react) to these price movements. This makes a complete system that puts repetition in action, which is especially important for automation.
 
The price is whatever the market agreed it to be at that moment, and it can change at anytime.

the words "moment" and "anytime" denote periodicity, therefor, by default and by human activity price action has time as a component....whether you choose to ignore the time component or not is a different approach.......
 
the words "moment" and "anytime" denote periodicity, therefor, by default and by human activity price action has time as a component....whether you choose to ignore the time component or not is a different approach.......

Time, in this sense of using a calendar and as I described earlier is used only for relativity purposes; to differentiate one moment from the next conceptually. If you remove the timestamps, the transactions still occurred. The price and how many contract were bought/sold at that price is fundamental; they cannot be removed or replaced. You could use a different construct besides calendar to label the contracts, such as an order number, and you would still get the same desired effect, which is to order the transactions to reference them historically. On the flip side, you could not remove the price....because an agreed price is fundamental to a contract. You could not remove the volume, because the agreement is the volume. newly agreed prices with new contracts happen as market forces dictate (e.g. all the "time" :D)

You can still use time based charts to observe price action; with many free charting packages, that's all you have to work with starting out. It would be up to the user to

An indicator I will be releasing shortly may assist in removing this time bias by focusing on price movement only, without regard to time. From my point of view, this makes it easier to react more objectively.
 
Yes that is all very well but you haven't actually explained HOW to trade price action. As a newbie trader I was left wanting more information.
 
Just another unsuccessful trader who can not make money from trading , has no income or proof of income from trading , is teaching everybody else how to trade.Only evidence we have is , he makes money from selling courses , not from trading.
 
Top