[Editor's note: This article was originally written on the 30th Dec, 2005]
Okay, so make your own title up!
In Part 1 I set out the basic ideas of P&F charting. For anyone who would like to read more on the subject there’s an absolute plethora of material out there – one book I’d thoroughly recommend is ‘Point & Figure Charting - The Complete Guide’ by Dr Carroll D Aby Jr. This book doesn’t waffle, which many do, and it’s the only one I’ve found that highlights variations in the methodology – depending on who you read and where you’ll find some target calculations can be performed several different ways for example.... I consider it a mark of thoroughness that this book considers some alternatives to the ‘tools’ of P&F. I’d add this to the book recommendations in my first article, and would opt for this in preference – I should add that I haven’t read the Updata book, by Jeremy Du Plessis, which I’d expect to be of a similar standard. (Forgive me, I add to my library regularly and there were other titles I chose before my 984th P&F book <g>)
Plug over then, and on with the rest of it....
Secure in the knowledge that an ideal TA book would consist of 3 pages for £50 where page 1 was an intro, page 2 told you how to make money, and page 3 carried a brief resume of page 2, I’ll try to keep this short. What works in P&F?
I’ve backtested extensively – I wrote a P&F program and built a backtester in it that tries to mimic actual trading, it records (blow by blow) moving stops, new highs/lows, the user sets a percentage to control entry....I consider it a faithful idiot. It’s probably a fair bit brighter than most backtesters however.
An entry signal is given as a bar completes on your chart – whatever time period you trade you cannot enter on the bar that signalled entry as only as the bar completes is the H/L info available for chart update. Charts gap overnight – there is little point entering a ‘buy at $25’ if it gapped up to $30 overnight, is there? I won’t bore you with details, my program enters on the bar after the signal, but only if it’s within user selected range of the entry signal itself. ie You don’t enter if the price gaps too far...
There are various exit conditions you can set – I set equal sized profit/loss stops, to be a ‘fair’ test... if you want 2:1 risk:reward that’s fine, just bear in mind that if the stop is closer than the profit exit you’ll see lower percentages when you go test it.
I looked at the SP500, I’ve tested on the FT100/250/350 and the SP500, Dow 30 etc in the past (on my website) and thought an update on the SP500 as New Year approached might be nice, markets tend to deliver roughly the same results over time – there isn’t (as far as I can detect) any stock group, market or index that is particularly good for P&F. Forex – yes, it seems to work okay on forex, but I don’t trade forex so it would be wrong of me to wax lyrical on something I know very little about.
Okay – some basic percentages then:
Double Top and Bull Catapult trades SP500 (2 years)
Right – this is tested from the last 500 days data, using my ‘idiot trader’ backtester, showing all the completed trades in that period. (There will be some trades still running, the backtester logs these separately). What do we see?
Well, percentage junkies will have homed in on the Bull Catapults, but with only 12 trades in 500 days and an average return across those 12 of 5.49% each you’re not going to be very busy. This might suit many – you’re probably looking at having 1 trade running at any one time. ‘Volatility%’ is something I looked at a while back when considering optimising boxsize and reversal count, I set a filter to reject trades if the volatility exceeds 8% as these seemed to offer poorer returns. Over time they do seem to add the odd percent, I think there’s some link with the overall market involved but I haven’t sorted that out yet. Like any filter it reduces the number of trades, and if it does that whilst maintaining or improving returns I’m all for it.
10% target – if you filter your trades and only enter those that are forecast to make 10% profit or more, then this is what you get... so trading all double top breakouts you get 59% winners, but if you only trade those forecast to make 10% profit or more (this is based on the Horizontal count price target, incidentally) then the win percentage goes up to 66% whilst number of trades drops from 1556 (all D Tops) to 195 – I doubt many of us would happily trade 1500+ signals in 2 years, but 195 is getting more manageable, and the win percentage and average returns are improved too.
You’ll note, I hope, that the more complex ‘Catapult’ isn’t any better than the humble Double Top breakout – some people assume more complex signals must be somehow ‘better’, this simply doesn’t seem to be so. In numerous backtests over the past 4 years or so I’ve found Double and Treble Tops/Bottoms produce similar win percentages to the more complex signals... the advantage of signals like triangles and catapults is that they reduce the total number of trades offered, allowing the trader to cover a bigger percentage of the signals presented.
Okay – so in a nutshell, trading P&F signals EoD you can currently expect 60-65% approx winners from the ‘raw’ Long signals. The Bear signals aren’t doing anything like as well – Double Bottoms are returning sub 40% in the same tests. When the markets are bullish, or flat to bullish, short signals seem to do very poorly – the returns during the late 1990’s show some very poor figures, for example. P&F reliability also dipped during the early 2000’s after the TMT bust – my impression is that this is a method that works well for long signals provided you aren’t in a bear market. I have yet to see bearish P&F signals achieve similar results in any type of market.
I have avoided incorporating Relative Strength as a prerequisite, in backtesting it seems to reduce trade numbers without greatly affecting the likelihood of winning, but....
Do bear in mind that there are a great many variables involved in all this – it may be that by setting a 30% target the RelStr charts combine magically with short signals... I haven’t tried every combination out. I have tested an awful lot however, and I have found little that seems to consistently improve on the ‘raw’ price chart signals.
What about intraday then?
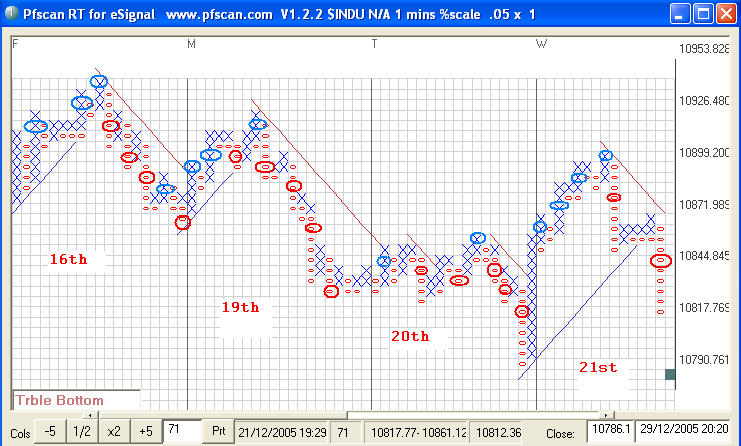
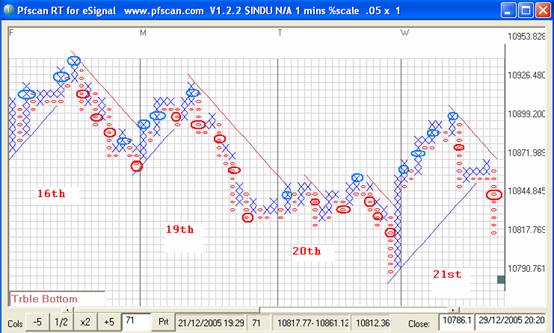
caption: Dow Jones, 16 Dec 2005 - 21 Dec 2005
Hope you can read this okay... here’s a chart of $INDU from early on Dec 16th through to the 21st, each day is indicated by a vertical line showing where the first new column that day formed. The chart is a 1 box reversal, based on a half percent boxsize – this works out to around 5-6 pts to the box. I’ve ringed the buy (blue) and sell (red) signals – no doubt I missed the odd one as I whizzed through this. Note that you’d be aiming to trade the first signal in any one direction, ie you don’t keep buying every time another buy pops up if you are already long!
So, the Dow hasn’t been doing much lately (I know, I’ve been watching it) but you can see how much of each swing has been signalled... follow on signals fire on minor moves, and you’ll note a tendency to see a final signal at the end of each swing pointing you the wrong way, but you’d really have to be trying to mess up to avoid taking the 3 earlier ones in most cases.
Where it goes a bit more squirrel shaped is when the Dow starts bumbling sideways....
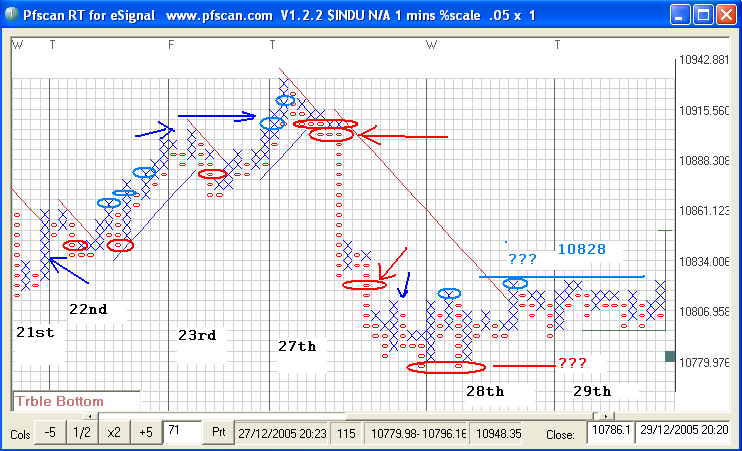
caption: Dow Jones, 21 Dec 2005 - 29 Dec 2005
The arrows in the above point out some of the bigger signals, occasionally duff ones have been highlighted (I hate those magazine articles that only show the thing working). There are repeated ‘up’ signals later on 22 nd, a small dip to the midpoint 23 rd chart, and the actual buy signal misses half the move sadly, unless you’d sat out the dip of 50 pts or so (I wouldn’t).
There’s a darn good short signal in the middle of the 27 th’s chart, and a good signal for the second leg later that day. After that it’s death by a thousand tiny zigzags – sensibly you’d probably lose on at least one buy signal before accepting the rangebound nature of the beast. The chart currently shows the Dow trading from about 10780-10828, which will not surprise many, you’d stay out until the breakout was obvious (whichever direction).
If you’ll excuse my attempts to highlight the main trades on a candle chart....
caption: Dow Jones, 20 Dec 2005 - 29 Dec 2005
Blue arrows highlight the buys, Red the sells, arrows are position somewhat approximately to show what the candlechart was doing while the P&F chart was being built.
Does it all work? Like any chart method it can do well, and it can fail dismally. I think the ‘raw figures’ for what is essentially a mechanical system (buy double top breakouts which are forecast to rise 10%+, exit when 10% up or down) are quite good for the EoD trader – commonsense dictates you’d trail a stop to exit, or use some other discretion in this, looking to improve over the raw figures.
I would point out that a 60-65% win rate is a good starting point, but if you don’t get your entry and exit right you’ll find you can still lose money trading these signals. I have 10850 currently as the Dow’s price objective, the downside objective was 10791 and that was reached in today’s final run. Whether it’ll get to 10850 via 10,000 I can’t say – you trade what happens, not what you expect to happen, so right now I’m waiting to see what tomorrow brings,
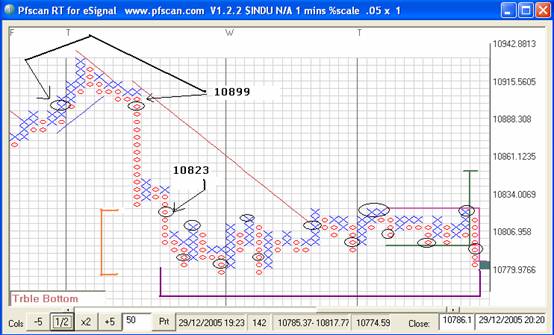
caption: Dow Jones, Close 29 Dec 2005
Latest, hot off the price then – a close up of the current situation. I’ve put brackets around the vertical and horizontal limits of the trading range and annotated it with a few figures. We’ve a buy 40 short of the top, and a sell 40 after it (which was good for 100 pts or so you’ll notice), another sell at the top of the trading range and a bunch of signals firing as the limits of the range are tagged. At the moment the signal is ‘down’, personally I’d want it to move a box or two lower yet to avoid shorting at the bottom of what might prove to be another cycle in the range.
Right, I overran a bit and skipped the resume, but I hope this will serve to carry on from Part 1 for those wanting to get a little deeper into the topic.
Okay, so make your own title up!
In Part 1 I set out the basic ideas of P&F charting. For anyone who would like to read more on the subject there’s an absolute plethora of material out there – one book I’d thoroughly recommend is ‘Point & Figure Charting - The Complete Guide’ by Dr Carroll D Aby Jr. This book doesn’t waffle, which many do, and it’s the only one I’ve found that highlights variations in the methodology – depending on who you read and where you’ll find some target calculations can be performed several different ways for example.... I consider it a mark of thoroughness that this book considers some alternatives to the ‘tools’ of P&F. I’d add this to the book recommendations in my first article, and would opt for this in preference – I should add that I haven’t read the Updata book, by Jeremy Du Plessis, which I’d expect to be of a similar standard. (Forgive me, I add to my library regularly and there were other titles I chose before my 984th P&F book <g>)
Plug over then, and on with the rest of it....
Secure in the knowledge that an ideal TA book would consist of 3 pages for £50 where page 1 was an intro, page 2 told you how to make money, and page 3 carried a brief resume of page 2, I’ll try to keep this short. What works in P&F?
I’ve backtested extensively – I wrote a P&F program and built a backtester in it that tries to mimic actual trading, it records (blow by blow) moving stops, new highs/lows, the user sets a percentage to control entry....I consider it a faithful idiot. It’s probably a fair bit brighter than most backtesters however.
An entry signal is given as a bar completes on your chart – whatever time period you trade you cannot enter on the bar that signalled entry as only as the bar completes is the H/L info available for chart update. Charts gap overnight – there is little point entering a ‘buy at $25’ if it gapped up to $30 overnight, is there? I won’t bore you with details, my program enters on the bar after the signal, but only if it’s within user selected range of the entry signal itself. ie You don’t enter if the price gaps too far...
There are various exit conditions you can set – I set equal sized profit/loss stops, to be a ‘fair’ test... if you want 2:1 risk:reward that’s fine, just bear in mind that if the stop is closer than the profit exit you’ll see lower percentages when you go test it.
I looked at the SP500, I’ve tested on the FT100/250/350 and the SP500, Dow 30 etc in the past (on my website) and thought an update on the SP500 as New Year approached might be nice, markets tend to deliver roughly the same results over time – there isn’t (as far as I can detect) any stock group, market or index that is particularly good for P&F. Forex – yes, it seems to work okay on forex, but I don’t trade forex so it would be wrong of me to wax lyrical on something I know very little about.
Okay – some basic percentages then:
Double Top and Bull Catapult trades SP500 (2 years)
| Setup | Wins | Trades | Win% | Avg Return % |
| D Top 10% P/L | 916 | 1556 | 59 | 1.90 |
| D Top 10% P/L Volatility% | 846 | 1388 | 61 | 2.41 |
| D Top 10% P/L 10% Target | 128 | 195 | 66 | 3.21 |
| D Top 10% P/L 10% Target Volatility% | 114 | 169 | 67 | 3.63 |
| Bull Cat 10%P/L | 65 | 123 | 53 | 0.50 |
| Bull Cat 10%P/L 10% Target | 9 | 12 | 75 | 5.49 |
Right – this is tested from the last 500 days data, using my ‘idiot trader’ backtester, showing all the completed trades in that period. (There will be some trades still running, the backtester logs these separately). What do we see?
Well, percentage junkies will have homed in on the Bull Catapults, but with only 12 trades in 500 days and an average return across those 12 of 5.49% each you’re not going to be very busy. This might suit many – you’re probably looking at having 1 trade running at any one time. ‘Volatility%’ is something I looked at a while back when considering optimising boxsize and reversal count, I set a filter to reject trades if the volatility exceeds 8% as these seemed to offer poorer returns. Over time they do seem to add the odd percent, I think there’s some link with the overall market involved but I haven’t sorted that out yet. Like any filter it reduces the number of trades, and if it does that whilst maintaining or improving returns I’m all for it.
10% target – if you filter your trades and only enter those that are forecast to make 10% profit or more, then this is what you get... so trading all double top breakouts you get 59% winners, but if you only trade those forecast to make 10% profit or more (this is based on the Horizontal count price target, incidentally) then the win percentage goes up to 66% whilst number of trades drops from 1556 (all D Tops) to 195 – I doubt many of us would happily trade 1500+ signals in 2 years, but 195 is getting more manageable, and the win percentage and average returns are improved too.
You’ll note, I hope, that the more complex ‘Catapult’ isn’t any better than the humble Double Top breakout – some people assume more complex signals must be somehow ‘better’, this simply doesn’t seem to be so. In numerous backtests over the past 4 years or so I’ve found Double and Treble Tops/Bottoms produce similar win percentages to the more complex signals... the advantage of signals like triangles and catapults is that they reduce the total number of trades offered, allowing the trader to cover a bigger percentage of the signals presented.
Okay – so in a nutshell, trading P&F signals EoD you can currently expect 60-65% approx winners from the ‘raw’ Long signals. The Bear signals aren’t doing anything like as well – Double Bottoms are returning sub 40% in the same tests. When the markets are bullish, or flat to bullish, short signals seem to do very poorly – the returns during the late 1990’s show some very poor figures, for example. P&F reliability also dipped during the early 2000’s after the TMT bust – my impression is that this is a method that works well for long signals provided you aren’t in a bear market. I have yet to see bearish P&F signals achieve similar results in any type of market.
I have avoided incorporating Relative Strength as a prerequisite, in backtesting it seems to reduce trade numbers without greatly affecting the likelihood of winning, but....
Do bear in mind that there are a great many variables involved in all this – it may be that by setting a 30% target the RelStr charts combine magically with short signals... I haven’t tried every combination out. I have tested an awful lot however, and I have found little that seems to consistently improve on the ‘raw’ price chart signals.
What about intraday then?
caption: Dow Jones, 16 Dec 2005 - 21 Dec 2005
Hope you can read this okay... here’s a chart of $INDU from early on Dec 16th through to the 21st, each day is indicated by a vertical line showing where the first new column that day formed. The chart is a 1 box reversal, based on a half percent boxsize – this works out to around 5-6 pts to the box. I’ve ringed the buy (blue) and sell (red) signals – no doubt I missed the odd one as I whizzed through this. Note that you’d be aiming to trade the first signal in any one direction, ie you don’t keep buying every time another buy pops up if you are already long!
So, the Dow hasn’t been doing much lately (I know, I’ve been watching it) but you can see how much of each swing has been signalled... follow on signals fire on minor moves, and you’ll note a tendency to see a final signal at the end of each swing pointing you the wrong way, but you’d really have to be trying to mess up to avoid taking the 3 earlier ones in most cases.
Where it goes a bit more squirrel shaped is when the Dow starts bumbling sideways....
caption: Dow Jones, 21 Dec 2005 - 29 Dec 2005
The arrows in the above point out some of the bigger signals, occasionally duff ones have been highlighted (I hate those magazine articles that only show the thing working). There are repeated ‘up’ signals later on 22 nd, a small dip to the midpoint 23 rd chart, and the actual buy signal misses half the move sadly, unless you’d sat out the dip of 50 pts or so (I wouldn’t).
There’s a darn good short signal in the middle of the 27 th’s chart, and a good signal for the second leg later that day. After that it’s death by a thousand tiny zigzags – sensibly you’d probably lose on at least one buy signal before accepting the rangebound nature of the beast. The chart currently shows the Dow trading from about 10780-10828, which will not surprise many, you’d stay out until the breakout was obvious (whichever direction).
If you’ll excuse my attempts to highlight the main trades on a candle chart....
caption: Dow Jones, 20 Dec 2005 - 29 Dec 2005
Blue arrows highlight the buys, Red the sells, arrows are position somewhat approximately to show what the candlechart was doing while the P&F chart was being built.
Does it all work? Like any chart method it can do well, and it can fail dismally. I think the ‘raw figures’ for what is essentially a mechanical system (buy double top breakouts which are forecast to rise 10%+, exit when 10% up or down) are quite good for the EoD trader – commonsense dictates you’d trail a stop to exit, or use some other discretion in this, looking to improve over the raw figures.
I would point out that a 60-65% win rate is a good starting point, but if you don’t get your entry and exit right you’ll find you can still lose money trading these signals. I have 10850 currently as the Dow’s price objective, the downside objective was 10791 and that was reached in today’s final run. Whether it’ll get to 10850 via 10,000 I can’t say – you trade what happens, not what you expect to happen, so right now I’m waiting to see what tomorrow brings,
caption: Dow Jones, Close 29 Dec 2005
Latest, hot off the price then – a close up of the current situation. I’ve put brackets around the vertical and horizontal limits of the trading range and annotated it with a few figures. We’ve a buy 40 short of the top, and a sell 40 after it (which was good for 100 pts or so you’ll notice), another sell at the top of the trading range and a bunch of signals firing as the limits of the range are tagged. At the moment the signal is ‘down’, personally I’d want it to move a box or two lower yet to avoid shorting at the bottom of what might prove to be another cycle in the range.
Right, I overran a bit and skipped the resume, but I hope this will serve to carry on from Part 1 for those wanting to get a little deeper into the topic.
Last edited by a moderator: