- Messages
- 2,325
- Likes
- 17
How and where to place stops is something which is always difficult to judge, particularly when you're starting out.
Newbies often place their stops far too close, and get stopped out. This is probably because of fear of taking a loss, or not knowing where the good places are to position them. There's nothing more infuriating than having your stop gunned, and then the market turns and zooms off without you.
The placement of stops is an art, not a science. There are a few ways of deciding how and where to put them, usually depending on the timeframe you are trading, and your strategy.
Today, something interesting happened on the Dow and ES (emini S&P futures) - stops were taken out (gunned), and it was easy to see it happening. You often see the 'big boys' (institutions) gunning stops at the beginning and end of trends. It means they get stock/contracts at 'cheap' prices, and the little boys (you and me and all the other retail traders) hopefully get stopped out and therefore miss the resulting move.
If you see stop gunning happening you can often be certain of a significant move about to happen.
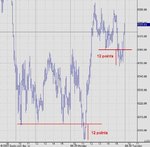
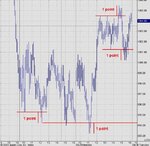
The following two charts show the typical amount that the big boys will drop the stock to gun the stops - 12 points on the Dow, and 1 point on ES in these examples.
These examples will illustrate how you need to work out the approximate amount that the market will move during stop gunning, and therefore you need to allow for this when deciding where to place your stops.
First, the 5 minute chart of the Dow:
Newbies often place their stops far too close, and get stopped out. This is probably because of fear of taking a loss, or not knowing where the good places are to position them. There's nothing more infuriating than having your stop gunned, and then the market turns and zooms off without you.
The placement of stops is an art, not a science. There are a few ways of deciding how and where to put them, usually depending on the timeframe you are trading, and your strategy.
Today, something interesting happened on the Dow and ES (emini S&P futures) - stops were taken out (gunned), and it was easy to see it happening. You often see the 'big boys' (institutions) gunning stops at the beginning and end of trends. It means they get stock/contracts at 'cheap' prices, and the little boys (you and me and all the other retail traders) hopefully get stopped out and therefore miss the resulting move.
If you see stop gunning happening you can often be certain of a significant move about to happen.
The following two charts show the typical amount that the big boys will drop the stock to gun the stops - 12 points on the Dow, and 1 point on ES in these examples.
These examples will illustrate how you need to work out the approximate amount that the market will move during stop gunning, and therefore you need to allow for this when deciding where to place your stops.
First, the 5 minute chart of the Dow: