You are using an out of date browser. It may not display this or other websites correctly.
You should upgrade or use an alternative browser.
You should upgrade or use an alternative browser.
snowrider
Well-known member
- Messages
- 423
- Likes
- 3
Hi Snowrider.
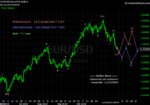
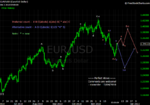
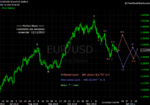
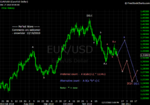
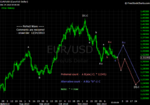
Do you think EUR initial move to 1.378 and now to 1.35 changes your preferred count to bearish?
Hi quaid, yes I am chaning to bearish count. You can see from my chart that 1.38 area is a critical to go bull or bear. The weak price behavior (opening high but filling back the gap) set off a bearish wave.
oiltrader81
Junior member
- Messages
- 37
- Likes
- 0
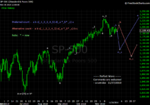
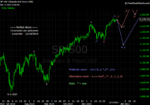
if the index keeps falling I do not know if the S&P500 will have anough strenght to get back to the 1230 -1250
take into account that we are almost at the end of this year and many investors will close their positions. so less volume and more speculative moves (which usually drive prices down)
take into account that we are almost at the end of this year and many investors will close their positions. so less volume and more speculative moves (which usually drive prices down)
snowrider
Well-known member
- Messages
- 423
- Likes
- 3
if the index keeps falling I do not know if the S&P500 will have anough strenght to get back to the 1230 -1250
take into account that we are almost at the end of this year and many investors will close their positions. so less volume and more speculative moves (which usually drive prices down)
Hi oiltrader81 - thanks for sharing. I agree that the thin volume contributes some speculative moves. If SP breaks 1180 support, it will need to find next support much deeper.
rajpatel_uk
Junior member
- Messages
- 30
- Likes
- 0
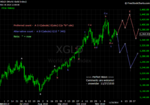
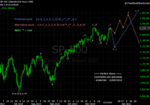
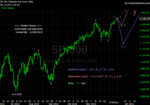
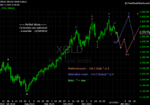
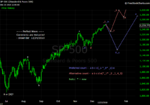
It looks like Wave 3 top is in and it is going for wave4, it should be excellent opportunity to go long for wave 5 ride in next week or so. Look at the timing of completion of wave 4 and Wave C for both hourly and daily chart.
Volume on daily chart indicates, this is not a major sell off, thus it suggests it will go higher once the trend is resumed.
Volume on daily chart indicates, this is not a major sell off, thus it suggests it will go higher once the trend is resumed.
Attachments
rajpatel_uk
Junior member
- Messages
- 30
- Likes
- 0
SPX Or ^GSPC - S & P 500Raj - what currency/commodity are you referring to? thx.
snowrider
Well-known member
- Messages
- 423
- Likes
- 3
It looks like Wave 3 top is in and it is going for wave4, it should be excellent opportunity to go long for wave 5 ride in next week or so. Look at the timing of completion of wave 4 and Wave C for both hourly and daily chart.
Volume on daily chart indicates, this is not a major sell off, thus it suggests it will go higher once the trend is resumed.
Hi Raj - Thanks for sharing your nice count on SP. What a nice surge on SP! It's bad that I only entered some light long since Wednesday because my bearish bias.
snowrider
Well-known member
- Messages
- 423
- Likes
- 3
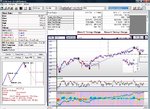
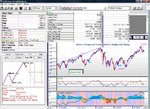
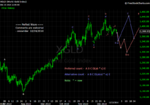
12/03/2010
I am too lazy to create another thread for December, so I'll continue on updating the November thread. Maybe I can create one thread for each quarter, e.g., 2011-Q1, 2011-Q2, ... etc. Let's finish up the December first.
I am too lazy to create another thread for December, so I'll continue on updating the November thread. Maybe I can create one thread for each quarter, e.g., 2011-Q1, 2011-Q2, ... etc. Let's finish up the December first.
Attachments
Similar threads
- Replies
- 31
- Views
- 12K
- Replies
- 20
- Views
- 7K