I have just been playing around with Rubenstein's options package. It is great for academic consideration of exposure etc but of limited practical value as all inputs must be done manually. It can not take a live feed.
I think that having a real time view of ones exposure in 3D would be very cool. Consequentially (and here comes the 'plug'...!) I will be incorporating such functionality in my forthcoming options programme when it is released late this year.
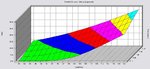
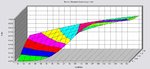
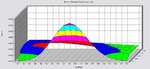
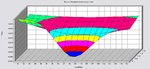
This will allow people to visualise their exposure not just at the spot price but for any price and to conduct sensitivity analysis over multiple price. volatility etc ranges.
What do you think? Is it worth adding in / would you use it?
Cheers,
VN
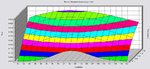
Vanilla call option struck atm (100) with 2 years to expiry, 20% implied vol, rf 10% and div 5%.
I think that having a real time view of ones exposure in 3D would be very cool. Consequentially (and here comes the 'plug'...!) I will be incorporating such functionality in my forthcoming options programme when it is released late this year.
This will allow people to visualise their exposure not just at the spot price but for any price and to conduct sensitivity analysis over multiple price. volatility etc ranges.
What do you think? Is it worth adding in / would you use it?
Cheers,
VN
Vanilla call option struck atm (100) with 2 years to expiry, 20% implied vol, rf 10% and div 5%.