One of the things I look for on a regular basis is stocks making a new 60 day high. I'm sure that i am not alone in this.
Today an interesting chart was thrown up for OXIG.
It appears that the recent 2 day move has broken the long standing overhead trendline which goes right back to June 1996 and created a new demand trendline. The volume spike was really serious.
Whilst fiddling with the chart I overlaid the Fibonacci retracement pattern based on the Oct 1997 high and the April 2001 low and got a brilliant fit.
Yesterdays close (201.5) broke the first Fibonacci level and suggests a first target of 240p
I attach a chart - only a line for clarity because of the time scale.
I know nothing of the fundementals but would be interested in any input.
Peter
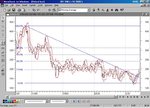