anton_baranovskiy
Junior member
- Messages
- 30
- Likes
- 0
Hi all,
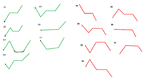
Glad to introduce you with our team research. Hope it will be interesting for intraday traders at NYSE/NASDAQ:
- we analyzed 200 screens of stocks which showed us a point for open position;
- separated out common points;
- identified an average time in position, which help you to maximize your profit.
L - long, S - short.
So wait for any questions.