Opening Range Breakouts what works?

rizwanuk

Member
Messages
66
Likes
2
Opening range break outs(ORB) has been a favourite technique used by many traders. I am starting this thread so that we can learn about this technique from the users of this forum.

Does any one here uses ORB's for their actual trading? or have used it in the past?

Why do ORB's work at all? I mean what is their foundation in the trader's psychology?


What works and what does not work in todays markets?

What was working in the past but is no longer working now ?

What has stopped working will it ever work again in the markets?

Do the ORB's work equally well in the Futures and Equity markets?


What happens when we apply filters for e.g range contraction on a previous day, is the pattern any more successful?

I watched the free portions of this presentation on ORB and found it to be useful

http://tradersstudio.com/Default.aspx?tabid=129

Has any one else watched it? Has anyone else got the full presentation and is it good?

Are there any good books or Stocks and commodities articles any one can recommend on ORB's.

I look forward to an interesting discussion and participation from the experienced users.
 
There is a very good video on this subject in the Articles section of this site by
Phil Newton called "15 Minute Break-out Strategy.

http://www.trade2win.com/knowledge/articles/general_articles/15-min-break-out-strategy/

It is the best advice on ORBs that I've seen.

All of your other questions can be answered yourself by looking at charts. It sounds though as if you're looking for absolute certainty in trading. It'll never happen. Get over it.

Paul
 
Thanks for responding and thanks for sharing the link I will go through it shortly.

No I am not looking for certainity, what makes you think that?

This is a game of probabilty and we just try to maximise our edge, we know it will never be 100% but still we make efforts to maximise it.

Does any one on this boards trade ORB's?
 
Going in the direction of the breakout is like 0.5 probability of being right, maybe less. It's as simple as to go in the opposite direction of the breakout, the probability of being right may be higher.

I find that when the price suddenly goes in one direction it has a tendency to move back in. Some explain breakouts as traders rushing to get out, but I thinks it could as well be explained as divergence.
 
I think the ORB works well in times when the markets have a large intra-day range but the markets have had low volatility the last few years.

Might be worth having a look at the ACD method. It also seems to work best with more volatile markets but the video clips are worth watching. http://www.trade2win.com/boards/showthread.php?t=12695

It is best to work out your own method, as I am sure those prepared to go through lots of charts can find something that works.
 
riswanuk, are you only interested in opening range breakouts or pre-market gap breakouts? If it's the latter I'm happy to share my strats.
 
Over the Top said:
riswanuk, are you only interested in opening range breakouts or pre-market gap breakouts? If it's the latter I'm happy to share my strats.

Many thanks for your offer, I would want to keep this thread focussed to ORB's, premarket gap breakouts are very interesting as well and either you can PM me or in a few days I will start a thread to disucss those, I also have a few observations to share on Pre Market Gap breakouts.

Its just that focussed discussions are useful, do you use or have ever used ORB's?
 
Anonymous said:
Going in the direction of the breakout is like 0.5 probability of being right, maybe less. It's as simple as to go in the opposite direction of the breakout, the probability of being right may be higher.

I find that when the price suddenly goes in one direction it has a tendency to move back in. Some explain breakouts as traders rushing to get out, but I thinks it could as well be explained as divergence.


If probability is 0.5 or less then we will only make money if we win bigger than our losses. Does that happen with ORB's?
 
I have no idea.

Sometimes it breaks out upwards and goes straight up. Sometimes it breaks out upwards and immediately plunges. At that particular price when it has broken out there is about 0.5 probability of choosing the right direction.

But I find that when it rushes up and I buy, as in chasing the market, the price tends to come back down, or come back down, hit my stop, then go straight up (and I have to bang my head against the wall).

So I don't like ORBs. I prefer the opposite direction.
 
So basically you fade the breakouts, is there any one here who trades ORB's these days?
Or any other insights on it?
 
Toby Crabel stated that the Opening Range Breakout is most effective after an inside narrow range 4 day (INR4) or after a narrow range 7 day (NR7) whether inside or not.

I like to look for these days to anticipate when the market is most likely to trade to its Average True Range Limit , relative to the previous day's 1600 ET close. All my data is based on the 0930 to 1600 ET time frame.

I have changed the criteria a little. On a daily chart, I look for inside day's when the range is below the 200 Period Average. NR4 and NR7 would be an added plus. I also like to see the NYSE Up Volume / Down Volume Spread inverse to the short term trend. In other words, if the market is in a short term uptrend, I like to see the NYSE Up / Down Volume Spread to be below its 200 Period Average. The reverse is true for a down trending market. This situation creates a type of "Coiled Spring" action, which usually releases in the direction of the overall trend. See Attched chart.

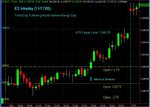
I also have a different definition for Open Range. I do not use a time frame range. I keep data that tracks the daily range extremes relative to the 0930 ET Open. For each contract, I use the average closest distance from the 0930 Open. This distance defines the Statistical Open Range, which for the ESZ05 contract is currently 2.75 + / - the Open Price.

I have also included two ES trend days that followed an Inside Narrow Range Day. One is an early morning breakout and the other is an afternoon breakout.

Charles
 

Attachments

  • ES Inside Narrow Range Days.jpg
    ES Inside Narrow Range Days.jpg
    90.4 KB · Views: 1,979
  • ES Trend Day 110205.jpg
    ES Trend Day 110205.jpg
    67.2 KB · Views: 852
  • ES Trend Day 111705.jpg
    ES Trend Day 111705.jpg
    73.4 KB · Views: 1,260
Toby Crabel stated that the Opening Range Breakout is most effective after an inside narrow range 4 day (INR4) or after a narrow range 7 day (NR7) whether inside or not.

I like to look for these days to anticipate when the market is most likely to trade to its Average True Range Limit , relative to the previous day's 1600 ET close. All my data is based on the 0930 to 1600 ET time frame.

I have changed the criteria a little. On a daily chart, I look for inside day's when the range is below the 200 Period Average. NR4 and NR7 would be an added plus. I also like to see the NYSE Up Volume / Down Volume Spread inverse to the short term trend. In other words, if the market is in a short term uptrend, I like to see the NYSE Up / Down Volume Spread to be below its 200 Period Average. The reverse is true for a down trending market. This situation creates a type of "Coiled Spring" action, which usually releases in the direction of the overall trend. See Attched chart.

I also have a different definition for Open Range. I do not use a time frame range. I keep data that tracks the daily range extremes relative to the 0930 ET Open. For each contract, I use the average closest distance from the 0930 Open. This distance defines the Statistical Open Range, which for the ESZ05 contract is currently 2.75 + / - the Open Price.

I have also included two ES trend days that followed an Inside Narrow Range Day. One is an early morning breakout and the other is an afternoon breakout.

Charles


Has anyone been having any success with the Opening Range Breakout Trading?
 
Top