What is a TICK?
A TICK is the number of NYSE upticking stocks vs downticking stocks. If 1000 stocks are upticking and 600 stocks are downticking you will get a TICK reading of + 400.
The TICK is a useful market internal tool to gauge market sentiment, design trading strategies, to prevent one from chasing, etc...
Traders use the TICK in various ways: some choose to fade TICK extremes, others use it to confirm market direction, and others incorporate the TICK into their trading setups.
In this article, I want to go over some of the TICK strategies and methods I personally use in my trading.
TICK HOOK
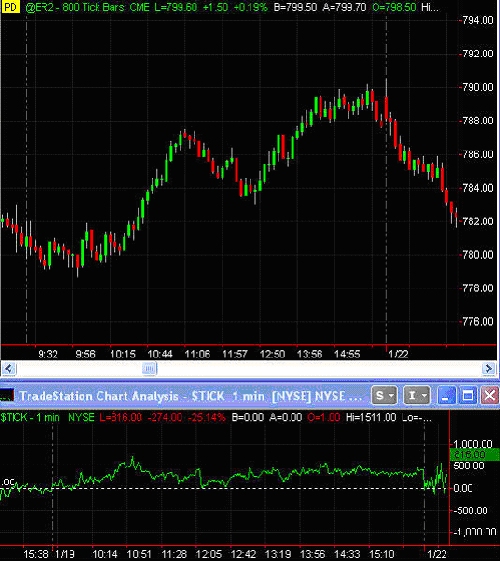
Let's begin with a TICK hook. The difference between a candlestick TICK chart and a line on close TICK chart is the visual TICK hook. A TICK hook is shaped like a "V" or an inverted V similar to a "N". At times they may look like a "W" or a "M". A line on close TICK chart shows this visually. Take a look below:
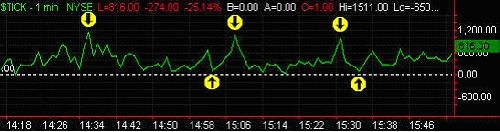
The yellow arrows point out some examples of TICK hooks. I use TICK hooks to enter as well as to exit. An entry would be made when the TICK's make a "V" or "W" hook. An exit would be at an "N" or "M" hook. TICK hooks also help a trader from chasing the market and timing a pullback. Instead of entering when the TICK's are at the upper range, wait for a retrace on the TICK and enter on a hook.
TICK FADES
A TICK fade is a common strategy used by many traders. The key here is to understand which TICK hook to fade. If TICK's remain above the zero line, you do not want to be fading a TICK hook at the upper range. A TICK spending the majority of its time above zero indicates bullish internals. A TICK strategy in such an environment is to fade the lower TICK hooks. Below is an example of a TICK fade.
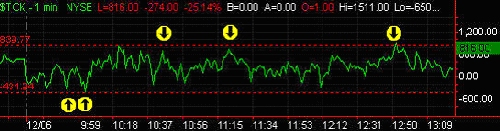
First thing you need to do is to wait for the TICK's to create a range. Once the TICK has placed its low and high, simply draw a horizontal line at both extremes. This the TICK range. Notice the two red horizontal lines on the chart above. Whenever the TICK's reach either side of the range, you fade the TICK. TICK fades are a little tricky at first to master. You need to create several rules in order to apply it to your trading strategies. For example, TICK fades on both sides work in a range bound market. In an up trending market you do not want to be fading a TICK hook at the upper range and vice versa in a down trending market. Play around with it and you will eventually start adding your own filters to TICK fades.
A second example is a TICK fade at an extreme reading. Traders will often fade extreme TICK readings of +1000, -1000, +1200, and -1200. I personally like to fade the extreme negative readings of -1000 and -1200. The markets will often bounce for a quick scalp. What about the positive extreme readings? I often find price to pullback and lift further after an extreme positive TICK reading. Take a look at the chart below.
The bottom chart shows a 1 minute candlestick TICK chart. The yellow arrows represent the TICK extreme readings of +1000 and more. On the price chart above, the yellow arrows indicate the same time the TICK's reached the extreme +1000 readings. Notice how price advanced and a TICK fade would of not worked.
One strategy I use is to wait for a pullback after a extreme positive TICK reading and enter on a TICK hook. TICK fades and TICK hooks are in no way exact science. Understanding market internals and market direction is important in increasing your probabilities of a winning trade using the TICK's. Observation and experience is key.
New TICK Low's and High's
In a trending environment I like to watch for a new TICK high/low to exit a position or to play a counter trend setup. In an up trending market, a new TICK low can offer warning signals for a possible trend reversal. First thing is to bracket the TICK's after it has established its high and low range. Any violation below the lower range is a new TICK low. Take a look at the chart below.
The ER2 was in a steady uptrend all throughout the morning and lunch hours. A new TICK low hit indicated by the yellow arrow on both panels. The ER2 then went to decline for approx 4 points. Also notice the break in the trend line.
If I am in a long position, a new TICK low is usually an exit signal even if price has not yet reached my target. The way I see it is that there is a shift in market sentiment and a clear warning signal for longs. For a counter trend setup, in an up trending market I would wait for a new TICK low and then short on a retracement in price or the TICK's. I consider this a conservative counter trend setup.
Bullish and Bearish TICK's
What are bullish TICK's? A bullish TICK occurs when the TICK's spend the majority of their time above zero. If the TICK's spend most of their time above zero in the morning session there is a good chance price will continue its uptrend. Take a look at the chart below.
Notice on January 19th, the TICK's spent the majority of the time above zero in the morning session. Also notice the uptrend in price. There is a good chance price will continue its trend which was the case in this example as price continued its uptrend in the afernoon session. When Bullish Tick's occur, you want to stay away from any shorts because you are fighting the trend. This is a great example when you should not be fading a positive TICK reading of +1000 or more.
What is a Bearish TICK? A bearish TICK is the exact opposite of a bullish TICK. TICK's spend more time below the zero line. However, a bearish TICK is not as obvious as a Bullish TICK. This is because TICK's tend to trade above and below the zero line even during a downtrend. It is extremely rare to see TICK's trading below the zero line the entire time. Take a look at the chart below.
In this chart notice how the TICK's spend more time trading below zero in the morning session. This indicates bearishness and price declined. In the morning session, if TICK's make a "N" or "M" hook at the zero line and fail to break above zero, this indicates tremendous bearishness.
Final Thoughts
These are just some examples of TICK's in action. The best thing for any trader to do before applying it into your trading strategy is to observe, learn, and practice first. After you get used to trading with the TICK's, be creative and start developing more complex strategies using TICK hooks, TICK fades, etc... I combine TICK hooks at pivots. I also have an opening setup that I use combining TICK's and tape. I hope this article gives a brief idea for those new to TICK's or for those who have yet to apply the TICK's into their trading.
Happy trading
A TICK is the number of NYSE upticking stocks vs downticking stocks. If 1000 stocks are upticking and 600 stocks are downticking you will get a TICK reading of + 400.
The TICK is a useful market internal tool to gauge market sentiment, design trading strategies, to prevent one from chasing, etc...
Traders use the TICK in various ways: some choose to fade TICK extremes, others use it to confirm market direction, and others incorporate the TICK into their trading setups.
In this article, I want to go over some of the TICK strategies and methods I personally use in my trading.
TICK HOOK
Let's begin with a TICK hook. The difference between a candlestick TICK chart and a line on close TICK chart is the visual TICK hook. A TICK hook is shaped like a "V" or an inverted V similar to a "N". At times they may look like a "W" or a "M". A line on close TICK chart shows this visually. Take a look below:
The yellow arrows point out some examples of TICK hooks. I use TICK hooks to enter as well as to exit. An entry would be made when the TICK's make a "V" or "W" hook. An exit would be at an "N" or "M" hook. TICK hooks also help a trader from chasing the market and timing a pullback. Instead of entering when the TICK's are at the upper range, wait for a retrace on the TICK and enter on a hook.
TICK FADES
A TICK fade is a common strategy used by many traders. The key here is to understand which TICK hook to fade. If TICK's remain above the zero line, you do not want to be fading a TICK hook at the upper range. A TICK spending the majority of its time above zero indicates bullish internals. A TICK strategy in such an environment is to fade the lower TICK hooks. Below is an example of a TICK fade.
First thing you need to do is to wait for the TICK's to create a range. Once the TICK has placed its low and high, simply draw a horizontal line at both extremes. This the TICK range. Notice the two red horizontal lines on the chart above. Whenever the TICK's reach either side of the range, you fade the TICK. TICK fades are a little tricky at first to master. You need to create several rules in order to apply it to your trading strategies. For example, TICK fades on both sides work in a range bound market. In an up trending market you do not want to be fading a TICK hook at the upper range and vice versa in a down trending market. Play around with it and you will eventually start adding your own filters to TICK fades.
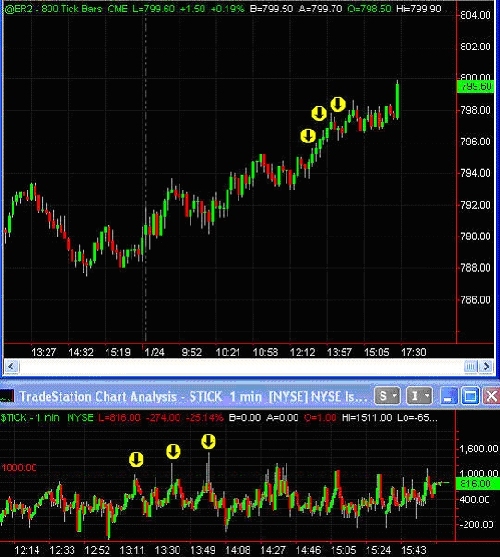
A second example is a TICK fade at an extreme reading. Traders will often fade extreme TICK readings of +1000, -1000, +1200, and -1200. I personally like to fade the extreme negative readings of -1000 and -1200. The markets will often bounce for a quick scalp. What about the positive extreme readings? I often find price to pullback and lift further after an extreme positive TICK reading. Take a look at the chart below.
The bottom chart shows a 1 minute candlestick TICK chart. The yellow arrows represent the TICK extreme readings of +1000 and more. On the price chart above, the yellow arrows indicate the same time the TICK's reached the extreme +1000 readings. Notice how price advanced and a TICK fade would of not worked.
One strategy I use is to wait for a pullback after a extreme positive TICK reading and enter on a TICK hook. TICK fades and TICK hooks are in no way exact science. Understanding market internals and market direction is important in increasing your probabilities of a winning trade using the TICK's. Observation and experience is key.
New TICK Low's and High's
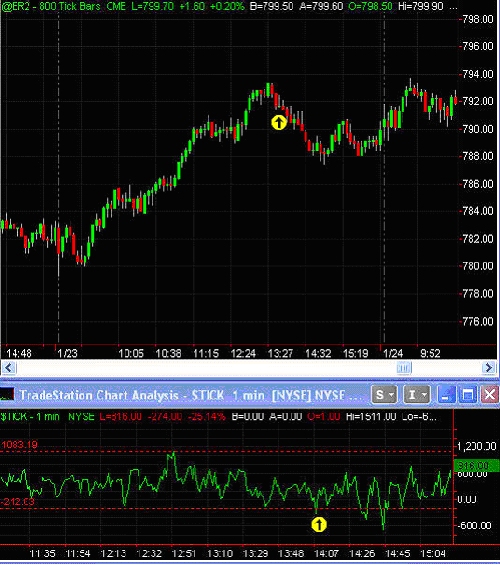
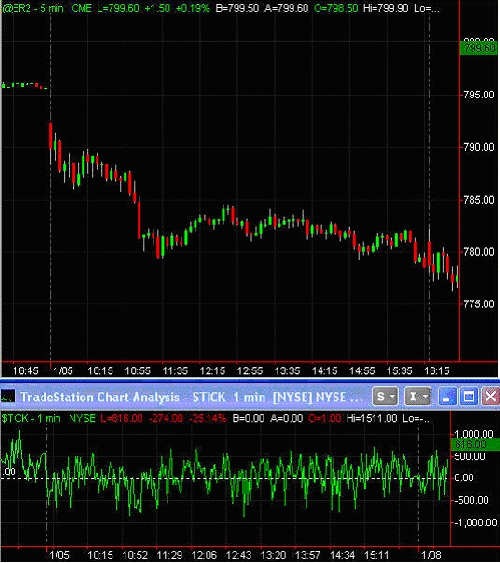
In a trending environment I like to watch for a new TICK high/low to exit a position or to play a counter trend setup. In an up trending market, a new TICK low can offer warning signals for a possible trend reversal. First thing is to bracket the TICK's after it has established its high and low range. Any violation below the lower range is a new TICK low. Take a look at the chart below.
The ER2 was in a steady uptrend all throughout the morning and lunch hours. A new TICK low hit indicated by the yellow arrow on both panels. The ER2 then went to decline for approx 4 points. Also notice the break in the trend line.
If I am in a long position, a new TICK low is usually an exit signal even if price has not yet reached my target. The way I see it is that there is a shift in market sentiment and a clear warning signal for longs. For a counter trend setup, in an up trending market I would wait for a new TICK low and then short on a retracement in price or the TICK's. I consider this a conservative counter trend setup.
Bullish and Bearish TICK's
What are bullish TICK's? A bullish TICK occurs when the TICK's spend the majority of their time above zero. If the TICK's spend most of their time above zero in the morning session there is a good chance price will continue its uptrend. Take a look at the chart below.
Notice on January 19th, the TICK's spent the majority of the time above zero in the morning session. Also notice the uptrend in price. There is a good chance price will continue its trend which was the case in this example as price continued its uptrend in the afernoon session. When Bullish Tick's occur, you want to stay away from any shorts because you are fighting the trend. This is a great example when you should not be fading a positive TICK reading of +1000 or more.
What is a Bearish TICK? A bearish TICK is the exact opposite of a bullish TICK. TICK's spend more time below the zero line. However, a bearish TICK is not as obvious as a Bullish TICK. This is because TICK's tend to trade above and below the zero line even during a downtrend. It is extremely rare to see TICK's trading below the zero line the entire time. Take a look at the chart below.
In this chart notice how the TICK's spend more time trading below zero in the morning session. This indicates bearishness and price declined. In the morning session, if TICK's make a "N" or "M" hook at the zero line and fail to break above zero, this indicates tremendous bearishness.
Final Thoughts
These are just some examples of TICK's in action. The best thing for any trader to do before applying it into your trading strategy is to observe, learn, and practice first. After you get used to trading with the TICK's, be creative and start developing more complex strategies using TICK hooks, TICK fades, etc... I combine TICK hooks at pivots. I also have an opening setup that I use combining TICK's and tape. I hope this article gives a brief idea for those new to TICK's or for those who have yet to apply the TICK's into their trading.
Happy trading
Last edited by a moderator: