This is a brief summary of the reading I have been doing around the NYMEX contract. I’m not looking to trade it as yet and if I eventually do, it will be via D4F. I’d be interested in others comments, particularly in relation to anything vital that I may have missed 🙂
History of Oil Prices
Highly volatile, price changes can be very rapid. Prices are normally quoted per barrel although the futures contract itself is for 1000 barrels. (1000 barrels is small beer, tankers can carry 1 million barrels worth at a time). The post Second World War price of oil was around $3 a barrel.
OPEC (Organisation of Petroleum Exporting Countries) was formed in 1960 with five members, Kuwait, Saudi Arabia, Iran, Iraq and Venezuela. Later Qatar, Indonesia, Libya, United Arab Emirates, Algeria and Nigeria joined. By the early 1970s OPEC had real power and were able to impose an oil embargo on the US and other countries supporting Israel during the Yom Kippur War, this sent the price of oil up to $12 a barrel. Further price rises occurred during the Iran Iraq war in 1979/80 and it rose to $35 a barrel in 1981. OPEC tried to stabilise prices but in 1985 the Saudis decided that they were tired of under producing whilst other OPEC members produced what they liked. This action led the price of oil to drop to $10 a barrel. Attempts were made again to stabilise the price at $18 a barrel but it proved difficult to maintain. There was a price rise to $25 in 1990 with the Iraqi invasion of Kuwait but once that was resolved the price fell back again and declined until 1994 when prices rose because of a booming economy in the East and the US, production was increased to keep prices stable once again but the turndown in the Japanese economy from 1997 onwards led to a drop in prices. In 1999 OPEC made an effort to reduce the price decline and cut production, by mid 2000 the price was up to almost $40 a barrel. The price again fell back to around the $25 level until this year with the Iraq War uncertainties it went over $30 a barrel again.
A chart of the historical oil prices and key events is seen below

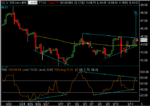
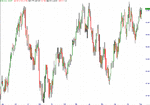
Current NYMEX Light Crude Price Chart

Details of the Futures Contract
Units Quoted $ per barrel
Contract Size – 1000 barrels
Minimum tick - $0.01 barrel
Tick value - $10
Margins - $5400 per contract
Trading hours – Traded open outcry 10am – 2-30pm US time. Also traded electronically virtually continuously via NYMEX ACCESS electronic exchange.
Monthly contracts, near month is the contract traded (i.e. July in June)
Typical price movement.
Here are price movements over the past few days. 0.71, 0.11, 0.53, 0.86, 0,85. So for the futures contract movements of $800 a day pretty commonplace.
Spreadbetting
Offered between 20-15 and 14-00 Monday to Friday.
Spread 0.06
£1 per 0,01 price movement.
Price charts on D4F are fairly reasonable.
Summary
A very liquid contract with plenty of movement. Market very susceptible to political and world event influences, if you are going to trade this you need to be by your screen 🙂 May potentially be a good alternative to index trading if the summer months are quiet.
Further Reading:
http://www.britefutures.com/
http://www.oilnergy.com/1cashpet.htm#brent
http://www.castletrading.com/charts.htm
http://www.futuresource.com/charts/charts.asp?sym=CLN03
History of Oil Prices
Highly volatile, price changes can be very rapid. Prices are normally quoted per barrel although the futures contract itself is for 1000 barrels. (1000 barrels is small beer, tankers can carry 1 million barrels worth at a time). The post Second World War price of oil was around $3 a barrel.
OPEC (Organisation of Petroleum Exporting Countries) was formed in 1960 with five members, Kuwait, Saudi Arabia, Iran, Iraq and Venezuela. Later Qatar, Indonesia, Libya, United Arab Emirates, Algeria and Nigeria joined. By the early 1970s OPEC had real power and were able to impose an oil embargo on the US and other countries supporting Israel during the Yom Kippur War, this sent the price of oil up to $12 a barrel. Further price rises occurred during the Iran Iraq war in 1979/80 and it rose to $35 a barrel in 1981. OPEC tried to stabilise prices but in 1985 the Saudis decided that they were tired of under producing whilst other OPEC members produced what they liked. This action led the price of oil to drop to $10 a barrel. Attempts were made again to stabilise the price at $18 a barrel but it proved difficult to maintain. There was a price rise to $25 in 1990 with the Iraqi invasion of Kuwait but once that was resolved the price fell back again and declined until 1994 when prices rose because of a booming economy in the East and the US, production was increased to keep prices stable once again but the turndown in the Japanese economy from 1997 onwards led to a drop in prices. In 1999 OPEC made an effort to reduce the price decline and cut production, by mid 2000 the price was up to almost $40 a barrel. The price again fell back to around the $25 level until this year with the Iraq War uncertainties it went over $30 a barrel again.
A chart of the historical oil prices and key events is seen below

Current NYMEX Light Crude Price Chart

Details of the Futures Contract
Units Quoted $ per barrel
Contract Size – 1000 barrels
Minimum tick - $0.01 barrel
Tick value - $10
Margins - $5400 per contract
Trading hours – Traded open outcry 10am – 2-30pm US time. Also traded electronically virtually continuously via NYMEX ACCESS electronic exchange.
Monthly contracts, near month is the contract traded (i.e. July in June)
Typical price movement.
Here are price movements over the past few days. 0.71, 0.11, 0.53, 0.86, 0,85. So for the futures contract movements of $800 a day pretty commonplace.
Spreadbetting
Offered between 20-15 and 14-00 Monday to Friday.
Spread 0.06
£1 per 0,01 price movement.
Price charts on D4F are fairly reasonable.
Summary
A very liquid contract with plenty of movement. Market very susceptible to political and world event influences, if you are going to trade this you need to be by your screen 🙂 May potentially be a good alternative to index trading if the summer months are quiet.
Further Reading:
http://www.britefutures.com/
http://www.oilnergy.com/1cashpet.htm#brent
http://www.castletrading.com/charts.htm
http://www.futuresource.com/charts/charts.asp?sym=CLN03


