Nowler's Trading Journal

After reading this journal, do you think Nowler will be a successful trader?

  • Yes

    Votes: 3 21.4%
  • No

    Votes: 4 28.6%
  • Not enough information yet

    Votes: 7 50.0%

  • Total voters
    14
Well the release went against me a bit.
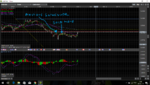
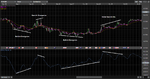
I put a fib on the high/low on the 1hr chart and moved my stop loss back behind the 38% level.

As you can see, the price spiked through the 38% level but stopped just short of my stop loss.

If it's going to hit it then it's going to do it soon.

EDIT:
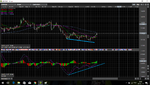
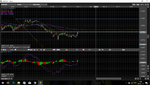
I was very tempted to sell into it again.
If I had of, it would have been with the same amount as the initial trade.
Lets see how this fairs out...
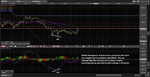
 

Attachments

  • 10 oct.png
    10 oct.png
    145.4 KB · Views: 244
Last edited:
Well that didn't work out for me... Stop loss triggered.

I'll wipe the dirt off and go again.
 
Well that didn't work out for me... Stop loss triggered.

I'll wipe the dirt off and go again.

Hi Nowler, your MACD was indicating a Bullish Divergence on 6th. Did you consider this when you placed the trade, if not, how do you use the MACD?
 
Last edited by a moderator:
I cannot remember the exact reason for getting into the trade as I don't always write my trades down but for the most part my reason for going short on the AUD/USD was price action. As per the attachment to this post; you can see where I sold in and to the left of that again was the high that I didnt think it would go beyond. After the bullishness of the USD last week, I expected the USD to pull on against the AUD, I still do actually but perhaps I was too rash jumping on that trade when I did. Perhaps I should have waited for some US economic release...
I also did a little reading and from what I gathered, the US could very well raise their interest rates soon but the Aussies, while their next bank rate move might actually be an increase, I wouldn't be till 2018. That obviously wasn't the main reason I got into that trade. The price action was what reeled me in... the rest was confluence. In hindsight though, I think I should have closed that trade before the AUD release. I am typically in and out of a trade in a few hours. That on the other hand was placed Sunday night GMT when the Aussies were starting their Monday 8am session. I feel I should stop doing this and wait till at least 8am GMT when the London folk are on.

I wouldn't have used just the 1hr for making the decision. I would have been going between the 5min, 15min, 30min, 1hr and 4hr.

I'm a bit embarrassed to say that I'm not actually sure how the MACD works.
I understand what it stands for but personally when I use it, I am looking to see if the momentum is with me (that the histogram bars are increasing and on the side of the zero line that the trend/trade is going). Again, I am unsure if i'm using it right, but I would also like the MA lines of the MACD to be jumping the zero line also. To me that would indicate a higher probability of success. Am I using this wrong?

EDIT: I am kinda aware that if the price makes a higher high but the histogram of the MACD doesnt, then this is divergence? And the price is likely to fall? The opposite is true for the other way around?

I need training!
I am a blank slate with nothing tying me down... I am willing and ready to plough hours and hours into learning how to trade correctly...I just need to find that opportunity to gain some form for training or a mentor. Being self-taught is nice, but often I am doubting myself on whether I am learning the right things, or learning them the right way.
I am literally ready to move at a moments notice if the opportunity arises
 

Attachments

  • 10 oct.png
    10 oct.png
    150.7 KB · Views: 217
Last edited:
Hi Nowler, your MACD was indicating a Bullish Divergence on 6th. Did you consider this when you placed the trade, if not, how do you use the MACD?

My last post was to you as well as Brumby but if you would...where exactly is this bullish divergence in your opinion?
 
Hope this helps a bit (y)
 

Attachments

  • Bullish Divergence.png
    Bullish Divergence.png
    83.5 KB · Views: 195
Wow... I'm so green!
This is deeply embarrassing but I thought it was the height of the histogram that I gauge that off of... :LOL:

Thanks for the help my friend

Well, the histogram is just represents the difference between the MACD and the signal, so the height of it also reveals divergences. Personally, MACD is one of the very few indicators I have found any value in. It helped me visualise the price structure. I don't use it now, but it helped me greatly in the early days...
If you are going to use an indicator it will make your chart more complicated just because there's more info in front of you. So, it's very important that you understand what it's shows and how it's calculated, otherwise it will just be a hindrance and you might as well ditch it. To help understand the MACD try plotting the MA's, on which it is based, over the price (These are exponential moving averages BTW)
 
Nowler you could also make your own rules based on common sense anticipation and instinct.I did .I lost money trading stocks initially but made it all back and a little more using spreadbetting on the dow and ftse.i did pack in as i found it to stressful and life absorbing.just trade small to begin with mate.
 
Well, the histogram is just represents the difference between the MACD and the signal, so the height of it also reveals divergences. Personally, MACD is one of the very few indicators I have found any value in. It helped me visualise the price structure. I don't use it now, but it helped me greatly in the early days...
If you are going to use an indicator it will make your chart more complicated just because there's more info in front of you. So, it's very important that you understand what it's shows and how it's calculated, otherwise it will just be a hindrance and you might as well ditch it. To help understand the MACD try plotting the MA's, on which it is based, over the price (These are exponential moving averages BTW)

I have successfully used the histogram to identify divergence in the past (lucky?) but in this example (attached) it identified nothing, whereas using it the way you said does.

I agree with you and I will make sure to better understand it. I do not use anything other than MACD, SMA's (don't really use lately), price action including previous structure and finally, macro news. I am not actually sure whether I could get more benefit from SMA's or EMA's... I just went through a phase of reading about SMA's and I never bothered to take them off my charts as they were not in my way.

I am not quite sure what you are suggesting I do though when you tell me to plot the MA's. Do you just mean that I break the MACD down and compare each section of the MACD to the price chart and see how it works?


Nowler you could also make your own rules based on common sense anticipation and instinct.I did .I lost money trading stocks initially but made it all back and a little more using spreadbetting on the dow and ftse.i did pack in as i found it to stressful and life absorbing.just trade small to begin with mate.

Hey mate :)

Perhaps.
I am not against making up my own rules based on experience but I would first like to fully understand how things were intended to be used. Once I know that, then I can tailor it if I see room for it.
Trading small is a must, for sure! Especially if I am still shaky on how to use the MACD.
The way I trade is very time consuming also and it gets quite tiring! Though on saying that, the more I learn, the less mental processing that I need to do
 

Attachments

  • 10thoct.png
    10thoct.png
    135.2 KB · Views: 188
I am not quite sure what you are suggesting I do though when you tell me to plot the MA's. Do you just mean that I break the MACD down and compare each section of the MACD to the price chart and see how it works?

Well, your using the MACD on standard settings, so plot two EMA's on your chart, one at 12 and the other at 26. Compare whats happening with the EMAs to whats happening to the MACD. A simple example: when the EMA's cross, what happens to the MACD?
 
Well, your using the MACD on standard settings, so plot two EMA's on your chart, one at 12 and the other at 26. Compare whats happening with the EMAs to whats happening to the MACD. A simple example: when the EMA's cross, what happens to the MACD?

Ok, I got you.
I have just removed the SMA's and replaced them with a 12 and 26 EMA.
I will check this out across a few charts for the next while and then take it from there.

I really appreciate the help mate
 
I'd also add: remove the signal and histogram in the first instance to simplify the MACD, once you've grasped the concept add them back...

The most important line on this simple MACD is the horizontal line = 0
 
I'd also add: remove the signal and histogram in the first instance to simplify the MACD, once you've grasped the concept add them back...

The most important line on this simple MACD is the horizontal line = 0

Have it like this?
 

Attachments

  • Altered MACD.png
    Altered MACD.png
    143.2 KB · Views: 188
Have it like this?

Spot on that mate (y)

I don't like the histogram personally because it draws your attention to the relationship between the MACD and the signal and away from the wider price structure as represented by the MACD line. But that's just my take on it...
 
Spot on that mate (y)

I don't like the histogram personally because it draws your attention to the relationship between the MACD and the signal and away from the wider price structure as represented by the MACD line. But that's just my take on it...


I'll give it a go for a while.
What's the worst that can happen :)
 
...And another thing! experiment with different settings (I've never used standard setting myself) As long as the lower value is roughly half of the higher value, anything goes...
 
Something I've been wondering about...
From my short observations, the MACD doesn't print the candle wicks. Would you disagree?

It registers while the price is there and the candle hasn't closed of course but if I'm not mistaken that current MACD bar on the histogram will reduce as the price of that candle receeds.
 
Top