Newbie here, Question about buying pullbacks.

thehunjo

Newbie
Messages
2
Likes
0
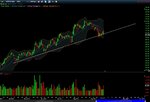
So I am looking at a PEP stock going long. I have been able to draw a trendline with 4 lows that have touched the line and popped back up. This line has been drawn since april. The fourth low has popped up and made a new high and has now come back down to the trendline. I was initially waiting for a candle bar type which touched the trendline the previous 4 times. Instead price went right through the line slightly and for the past 5 days price has just traded below and above the line closely clustered together. When I look at the chart I see that people are somewhat unsure of where to take the price. So does anybody have any tips they could share? Should I wait till price has broken out of the cluster or should I just find something else to trade?
 
how about you post a chart to go with your post? ;)
how long have you traded pullbacks?
 
how about you post a chart to go with your post? ;)
how long have you traded pullbacks?

Here is the chart. I have only started trading recently.
 

Attachments

  • PEP.jpg
    PEP.jpg
    172.2 KB · Views: 300
glancing at your chart, price has gone back below the trendline. you can be aggressive by selling any time after the close of that last candle, or be conservative and wait for a pullback to the area of that trendline before going short.
if you have studied support and resistance you would have a good idea where price can have trouble.
 
hey thanks for the information. it has been really helpful to me also. getting started in trading
 
The Daily shows up trend sure. Last day was a bearish engulfing candle, supposedly that means caution for longs.

To answer your question, the best way I've found to trade retracements (and to successfully identify them) is through the use of Chart Patterns. A correction often occurs in three waves, so identifying three swings automatically in real-time can provide a setup to enter near the probable lows in an uptrend. The best patterns for this purpose are the ABCD and the M&W.

While the Daily up trend was going on, you can see M-patterns provided identification of the lows, giving lower risk entry possibility.
PEPDaily.jpg

More recently, at the Support TrendLine, you can use the Hourly chart and find ABCD patterns that led to trade worthy lows for a swing trade.

PEP60.jpg

Currently I see no pattern, so i'd be careful buying.

Specific entry method can vary a great deal, you could use momentum, candles, some retracement of the pattern itself, P&F patterns, etc. As always, its the exits and money management that are more crucial to making money.
 
never get tooo hung up on patterns or where the price has been.....the market will decide whats next !

set some rules and follow them to the letter..........its not pattern recognition that makes you money in the long term .....its a professional approach , consistency , discipline and money/risk management

good luck !
N
 
Top