Nasdaq Comp Gaps and Reversals Thread

tradesmart

Experienced member
Messages
1,286
Likes
22
Gaps above and below - The Naz is spoilt for choice once again, which one to fill first....?!

Or are we seeing a potential Island Reversal in the making.....?
 

Attachments

  • 18-05-04.gif
    18-05-04.gif
    10 KB · Views: 587
Question on the point of being answered.......! :cool:

But I guess that we need a rise north clear of the now filled top gap to confirm the Island reversal - normally a powerful trend reversal indicator.
 

Attachments

  • 18-05-04a.gif
    18-05-04a.gif
    10.8 KB · Views: 522
Looking at the BIG picture, RSI divergence is a very, very consistant reversal indicator...........
 

Attachments

  • 18-05-04b.gif
    18-05-04b.gif
    30.7 KB · Views: 575
Well, the bullish surge today above the Island Reversal has opened up yet another yawning gap! – gaps have been filled pronto recently, sometimes the same day........ We’ve hit recent resistance at around the 1935 level and RSI is fully extended, so watching closely……
 

Attachments

  • 19-05-04.gif
    19-05-04.gif
    11.5 KB · Views: 512
What was I saying about gaps being filled pronto, sometimes the same day…..?!………and so down it came from the opening highs to fill that big gap – plainly one too many….

Very short term negative divergence on RSI as the price hit 1936 indicating the reversal….

And I just love it when a plan comes together…… ;)

The guri have mentioned the price of oil as the reason for the intraday reversal, but I just see it as a technical trading move that was likely to happen anyway – gaps just get filled!

The lower Island still remains remote as a potential major reversal indicator, but volatile times we live in….
 

Attachments

  • 20-05-04.gif
    20-05-04.gif
    13.7 KB · Views: 490
Just to keep things in perspective…..!……we’ve barely had a 23.6% fib retracement of the huge falls from the 5k+ heady days of early 2000 (was it really just 4 years ago..?!)

Still above the 100ema but with no sign of a bottom developing yet on RSI…..

The start of a new bull run or a suckers rally?…..the jury is still out…. :confused:
 

Attachments

  • 20-05-04a.gif
    20-05-04a.gif
    23.1 KB · Views: 503
Still holding above the Island gap. A bull flag, PD on RSI and maybe the tentative start of an up channel…..looks positive…!

(but generally "sell in May and go away" appears to be the flavour of the month so far... :| )
 

Attachments

  • 21-05-04.gif
    21-05-04.gif
    16.2 KB · Views: 489
Despite the bullish indications mentioned earlier, it just had to fill the opening gap before it could head north………

Fibonnaci retracement levels coming into play as always……

Consistent or what…….?!........ :cheesy:
 

Attachments

  • 21-05-04a.gif
    21-05-04a.gif
    14.4 KB · Views: 436
If a stock gaps up U$ 4 or 5 after a piece of good news and then stays strong for several days after that, would you say that the gap is likely to be filled if the piece of news that caused the gap has now resulted in a truer valuation of the Company's stock price ?
 
Salty - I guess that the answer to that one is very stock specific, but I’ve noticed that very often a ‘gap up’ on good news is sold into, so that the gap is almost inevitably filled pronto….!

Couldn’t find any that have gapped $4-5, but a couple of examples I’ve noticed recently are JNPR and NTES (charts attached) As part of general day-to-day price/sentiment fluctuations, they seem to create gaps and trade to fill them very quickly….probably typical of most Nasdaq stocks.

Naz or Mr Charts might have some other comments/ examples on stock ‘gap’ syndromes and typical outcomes ….?
 

Attachments

  • NTES.gif
    NTES.gif
    16.4 KB · Views: 442
  • JNPR.gif
    JNPR.gif
    15.7 KB · Views: 440
Hi Tradesmart

In general, would you say that large gaps either take a long time to get filled or are never filled whilst small / medium gaps are normally filled fairly quickly ?

For example, on Friday MRVL gapped up around US$ 2 and never looked back whilst GILD gapped up around 60 cents or so and the gap was filled before 3pm.

Is this behaviour fairly typical ?
 
Watching for the triangle break today, and if the futs hold up, yet another gap to be resolved…..!

Salty – post stock specific questions in the ‘US Stocks’ forum – that’s where the experts hang out….. ;)

Regards
 

Attachments

  • 24-05-04.gif
    24-05-04.gif
    14.8 KB · Views: 375
My question was not stock specific, hence the use of the words "In general..."

I mentioned specific stocks as an example but my actual question was not specific to those stocks.
 
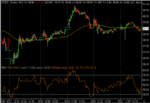
Given the discussion on Gaps, I thought I would give you the wisdom I am currently covering on a candlesticks book.

The theory on 'windows' (candlestick speak for gaps) is that closing the window is bearish and should happen on the next stick, but the gap itself is a continuation signal as opposed to a reversal, unless the gap itself is a doji or very small candle which signifies a possible change whereafter the next bar will confirm either a continuation, congestion or reversal. Further to which a window not closed in 5 candles assures a strong trend in the direction of the gap.

This may sound like Greek/Japanese but I found it interesting and often accurate.

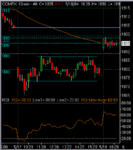
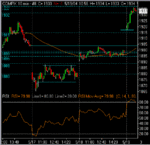
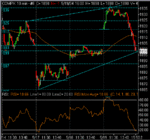
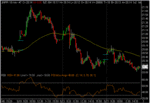
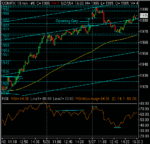
The interpretation on the Gap everyone refferred too would be the initial gap is not a doji which is positive however the next bar while down did not extend far enough down to be an engulfing Bear signal suggesting a fall and hinted merely at change which led to some congestion, after 5 bars without closing the window the original move upwards continued, which is pretty much spot on for that period.

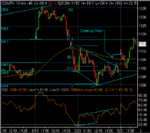
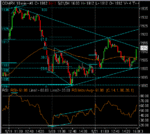
Although it has since come down, some have still noted that the gap level is an area of support which is also candlestick theory and appears to hold for now, despite the formation being awhile back.
 
Massive opening gap, and the price continuation gap from Friday closed promptly today. Weak RSI after the second lower high a good short confirmation signal – news flow will probably dictate whether closing flat topped triangle is bull or bear ……!?..... :confused:

ps - Crude, gasoline close at all-time highs

Salty – I’m not sure that there is a general answer to your question, but gapping behaviours probably depend on market conditions. If an index/stock gaps up and is able to trade higher than its opening price for a lengthy period, it is showing strength; if the gap is closed very quickly, this is likely to show weakness imho. Hope this helps in some way.

The Baptist – Interesting post! – which timeframe do you use for your candlestick charting, and when you say “ the gap everyone referred to” do you mean the apparent ‘Island Reversal’ gap that the Nasdaq made last week, and referred to in the posts/charts above? – Thanks – great input…!....... :cheesy:
 

Attachments

  • 24-05-04a.gif
    24-05-04a.gif
    13.9 KB · Views: 375
I use daily bars, the extent smaller timescales conform is unknown to me , I would expect some conformity, but more significance to the bigger timeframes.

The gap referred to was that indicated in tradesmarts first chart on this thread.
 
An amazing relief rally yesterday (definitely a relief after the recent choppy action.....!) A full closure of Monday’s gap and a bounce off the 100ema signalling the reversal.

Quite often a 38.2/50% retracement follows these surges, so will be watching for a pullback…… :cool:
 

Attachments

  • 26-05-04.gif
    26-05-04.gif
    15 KB · Views: 342
Well, the Island Reversal that kicked off the thread last week has proved to be the powerful trend reversal indicator suggested so far, and the Naz has now risen over 100 points north, and is well clear of the 100ema shown in the 10min timeframe.

No hint of retracement yet after Tuesdays big rally which seems bullish in the face of some negative news/data yesterday, and likely a sign that the market is expecting more upside......

Suspect that we might see a pullback before the long holiday weekend on both sides of the pond though....... ;)
 

Attachments

  • 27-05-04.gif
    27-05-04.gif
    17.2 KB · Views: 318
As mentioned yesterday, the market was expecting, and got, more upside and yet another opening gap just waiting to be filled and so it was – ND on RSI signalling the top of the move at 1992 resistance and PD signalling the bottom at 1968 support.

Looking for a likely pullback to red today after 5 green days for the Naz and the long weekend ahead.

All of these moves/chart profiles are mirrored virtually identically on the tradeable NDX (Nasdaq 100 index) and QQQ (Nasdaq 100 index tracking stock) charts attached – spot the difference – not much..!…… :cool:
 

Attachments

  • COMPX.gif
    COMPX.gif
    13.1 KB · Views: 282
  • NDX.gif
    NDX.gif
    11.4 KB · Views: 306
  • QQQ.gif
    QQQ.gif
    12.4 KB · Views: 309
The Gap

Salty Gibbon said:
If a stock gaps up U$ 4 or 5 after a piece of good news and then stays strong for several days after that, would you say that the gap is likely to be filled if the piece of news that caused the gap has now resulted in a truer valuation of the Company's stock price ?

TradeSmart: Great charts and explanation
Salty: The discussion here focuses on gaps almost always being filled. While that occurs often there are other patterns that a good number of traders I know look for called false gap retracements.

http://www.trade-ideas.com/Help.html#FGUR
 
Top