You are using an out of date browser. It may not display this or other websites correctly.
You should upgrade or use an alternative browser.
You should upgrade or use an alternative browser.
My Hedged Fund - Another "Trend-Following" Post
- Thread starter myhedgedfund
- Start date
- Watchers 10
We've obviously been on a similar path. I tried getting cute with some signals last year, and it ended up costing about 10% of my equity in P/L. There were two big bloopers - not taking an AUD long signal just before it rallied 10% in spot, and not taking a sugar long signal, shortly prior to a 20% rally.
There were a few occasions when I skipped signals and it saved money, but the overall effect was sharply negative.
What I would say is that I have no issue with modifying the strategy from time to time. You can't possibly know everything on day 1, so it's only natural that (subtle) alterations will be made along the way. As an extreme example, the Turtles changed their channel daycount when brokers cottoned on to the system and started jamming their stops. I've made a couple of modifications in the last six months, one of which is to include a drawdown limit. I also threw one market out (CAD) and brought in the 10yr T-note, to achieve (I believe) a better balance.
But by far and away the biggest issue is in not taking entry signals, it's imperative to take them all.
The self-fulfilling prophecy of trying to save a few £'s by not taking signals/getting out before your stop is hit (guilty as charged), and the end result being that it costs you significantly more £'s, is always evident when you break certain rules which really must never be broken.
I agree, modifications which you've reflected on and tested should always be implemented if they're going to potentially add to your bottom line. I'm still making subtle changes to my strategy like yourself, but i think i'm getting very close to the point where the only thing on my mind will be correct execution.
With regards to your drawdown limit, is that to stop you giving back more than x% of open profits?
myhedgedfund
Junior member
- Messages
- 39
- Likes
- 1
You're long nat gas? It looks like a huge downtrend to me.. what is your criteria for determining trend?
Sorry for the use of short-hand. I am not long on natural gas (UNG), which is a sideways trend at this point, but FCG which I call in my own files "Natural Gas Exploration and Production." A more complete description of the ETF is below:
"The ISE-Revere Natural Gas Index is an equal-weighted index comprised of exchange-listed companies that derive a substantial portion of their revenues from the exploration and production of natural gas."
The uptrend started here in late August, I've had buy signals for a few weeks now.
myhedgedfund
Junior member
- Messages
- 39
- Likes
- 1
MHF
Thanks for replying to all our points, believe me I and I think the others aren't trying to goad you.
Back to your hedging part, you say you will trade some shorts against longs, I understand that but where are your shorts? Or are some of those ETFs short ones (although they're bought)?
I understand... I'm answering because your feedback seems to come in good faith.
In the recent past I had some shorts, but at this point none of my short equity/commodity ETF's is giving buy signals. The Treasury Index is (TBT), and I'm there... The Yen (YCS), China (FXP) and Gold (DZZ) may be giving signals at some point within the next few weeks.
meanreversion
Senior member
- Messages
- 3,398
- Likes
- 538
Good feedback, thanks.
meanreversion
Senior member
- Messages
- 3,398
- Likes
- 538
Boston buddy, you NEED to make daily comments on this thread otherwise it will submerge forever.
myhedgedfund
Junior member
- Messages
- 39
- Likes
- 1
Week 2 - Is it Information or Just Noise? The Make of a “Weekly” Trader.
I have found that the farther away from the minute to minute changes in the Market I am, the better I perform.
Say that one day the Market goes up by 1% without a minute of my attention. “Great day!” I think, and feel energized, happy and with the proverbial “jump in the step.” Now I do not care how the Market got to the 1% [gradual rise (#1), down then up(#2) or significantly up and then "down" (#3)], only that it got there, and it made me money.
On another day, things are slow at the office, and I follow the market the entire day. Change at the end of the day? Up 1%. How do I feel? If conditions #2 and #3 above are observed, I feel down, like I lost big that day. Why would that be? Why does the 1% feel so different for me under those two conditions?
I encourage anyone in the trading / investing arena to read “Fooled by Randomness” by Nassim Nicholas Taleb (this is the second time I quote him on these posts; it will be the last for a while.) Nassim does a great job in covering the topic towards the end of Chapter 3. With full credit to Nassim, I here present you with one of his examples:
“Let us manufacture a happily retired dentist, leaving in a pleasant sunny town. We know a priori that he is an excellent investor, and that he will be expected to earn a return of 15% in excess of Treasury bills, with a 10% error rate per annum (what we call volatility.) It means that out of 100 sample paths, we expect close to 60% of them to fall within a band of plus and minus 10% around the 15% excess return. It also means that 95 sample paths would fall between -5% and 35%.”
“Clearly, we are dealing with a very optimistic situation. The dentist builds for himself a nice trading desk in his attic, aiming to spend every business day there watching the market, while sipping decaffeinated cappuccino. He has an adventurous temperament, so he finds this activity more attractive than drilling the teeth of reluctant little old Park Avenue ladies.”
“He subscribes to a web-based service that supplies him with continuous prices, now to be obtained for a fraction of what he pays for his coffee. He puts his inventory of securities in his spreadsheet and can thus instantaneously monitor the value of his speculative portfolio. We are living in the era of connectivity.”
“A 15% with 10% volatility per annum translates into a 93% probability of success in any given year. But seen at a narrow time scale, this translates into a mere 50.02% probability of success over any given second as shown below”
“At the end of every day the dentist will be emotionally drained. A minute-by-minute examination of his performance means that each day he will have 241 pleasurable minutes against 239 unpleasurable ones. These amount to 60,688 and 60,271, respectively, per year. Now realize that if the unpleasurable minute is worse in reverse pleasure than the pleasurable minute is in pleasure terms, then the dentist incurs a large deficit when examining his performance at a high frequency.”
Here I skip to Nassim’s conclusions:
Understanding one's strengths and weaknesses are key for trading success. Any thoughts on the topic?
Current Positions
This week I sold my Peru (EPU) position, added new positions on Home Construction (ITB) and Palladium (PALL), and added a block to my existing Malaysia (EWM) position. You can find my current positions in more detail here.
Performance for the week was good, with only three down positions (Oil & Gas Exploration, Telecom and Retail.) The leveraged positions performed particularly well, with Energy (ERX) up ~10% and Financials (FAS) up ~9% for the week.
“My Hedged Fund” performance –
Total World Stock (ACWI) –
S&P 500 (SPY) –
European, Australasian and Far Eastern Markets (EFA) –
Commodities (DBC) –
What Next Week May Bring
Retail (XRT) and South Africa (EZA) continue to weaken; I may see sell signals on them next week. If I do, I’ll be ready to buy on 1-2 of several ETF’s with current buy signals. Some of the strongest signals are in Financials (KBE, KIE, KRE), Semiconductors (SMH) and Agriculture (MOO). I am far from seeing any buy signals from the shorts (other than Gold) and the fixed income world (other than JNK.)
Happy trading from continuously snowy Boston
Boston
I have found that the farther away from the minute to minute changes in the Market I am, the better I perform.
Say that one day the Market goes up by 1% without a minute of my attention. “Great day!” I think, and feel energized, happy and with the proverbial “jump in the step.” Now I do not care how the Market got to the 1% [gradual rise (#1), down then up(#2) or significantly up and then "down" (#3)], only that it got there, and it made me money.
On another day, things are slow at the office, and I follow the market the entire day. Change at the end of the day? Up 1%. How do I feel? If conditions #2 and #3 above are observed, I feel down, like I lost big that day. Why would that be? Why does the 1% feel so different for me under those two conditions?
I encourage anyone in the trading / investing arena to read “Fooled by Randomness” by Nassim Nicholas Taleb (this is the second time I quote him on these posts; it will be the last for a while.) Nassim does a great job in covering the topic towards the end of Chapter 3. With full credit to Nassim, I here present you with one of his examples:
“Let us manufacture a happily retired dentist, leaving in a pleasant sunny town. We know a priori that he is an excellent investor, and that he will be expected to earn a return of 15% in excess of Treasury bills, with a 10% error rate per annum (what we call volatility.) It means that out of 100 sample paths, we expect close to 60% of them to fall within a band of plus and minus 10% around the 15% excess return. It also means that 95 sample paths would fall between -5% and 35%.”
“Clearly, we are dealing with a very optimistic situation. The dentist builds for himself a nice trading desk in his attic, aiming to spend every business day there watching the market, while sipping decaffeinated cappuccino. He has an adventurous temperament, so he finds this activity more attractive than drilling the teeth of reluctant little old Park Avenue ladies.”
“He subscribes to a web-based service that supplies him with continuous prices, now to be obtained for a fraction of what he pays for his coffee. He puts his inventory of securities in his spreadsheet and can thus instantaneously monitor the value of his speculative portfolio. We are living in the era of connectivity.”
“A 15% with 10% volatility per annum translates into a 93% probability of success in any given year. But seen at a narrow time scale, this translates into a mere 50.02% probability of success over any given second as shown below”
Probability of Success at Different Scales
Scale Probability
1 year - 93%
1 quarter - 77%
1 month - 67%
1 day - 54%
1 hour - 51.3%
1 minute - 50.17%
1 second - 50.02%
“Over the very narrow time increment, the observation will reveal close to nothing. Yet the dentist’s heart will not tell him that. Being emotional, he feels a pang with every loss, as it shows in red on his screen. He feels some pleasure when the performance is positive, but not in equivalent amount as the pain experienced when the performance is negative.”Scale Probability
1 year - 93%
1 quarter - 77%
1 month - 67%
1 day - 54%
1 hour - 51.3%
1 minute - 50.17%
1 second - 50.02%
“At the end of every day the dentist will be emotionally drained. A minute-by-minute examination of his performance means that each day he will have 241 pleasurable minutes against 239 unpleasurable ones. These amount to 60,688 and 60,271, respectively, per year. Now realize that if the unpleasurable minute is worse in reverse pleasure than the pleasurable minute is in pleasure terms, then the dentist incurs a large deficit when examining his performance at a high frequency.”
Here I skip to Nassim’s conclusions:
- “Over a short time increment, one observes the variability of the portfolio, not the returns. In other words, one sees the variance, little else.
- Our emotions are not designed to understand the point. The dentist did better when he dealt with monthly statements rather than more frequent ones. Perhaps it would be even better for him if he limited himself to yearly statements.
- When I see an investor monitoring his portfolio with live prices on his cellular telephone or his handheld, I smile and smile.”
Understanding one's strengths and weaknesses are key for trading success. Any thoughts on the topic?
Current Positions
This week I sold my Peru (EPU) position, added new positions on Home Construction (ITB) and Palladium (PALL), and added a block to my existing Malaysia (EWM) position. You can find my current positions in more detail here.
Performance for the week was good, with only three down positions (Oil & Gas Exploration, Telecom and Retail.) The leveraged positions performed particularly well, with Energy (ERX) up ~10% and Financials (FAS) up ~9% for the week.
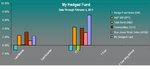
“My Hedged Fund” performance –
- Week - up 4.93%,
- YTD - up 4.04%
Total World Stock (ACWI) –
- Week - up 2.42%
- YTD - up 2.05%
S&P 500 (SPY) –
- Week - up 1.70%
- YTD - up 2.82%
European, Australasian and Far Eastern Markets (EFA) –
- Week - up 3.63%
- YTD - up 2.11%
Commodities (DBC) –
- Week - up 3.33%
- YTD - up 1.72%
What Next Week May Bring
Retail (XRT) and South Africa (EZA) continue to weaken; I may see sell signals on them next week. If I do, I’ll be ready to buy on 1-2 of several ETF’s with current buy signals. Some of the strongest signals are in Financials (KBE, KIE, KRE), Semiconductors (SMH) and Agriculture (MOO). I am far from seeing any buy signals from the shorts (other than Gold) and the fixed income world (other than JNK.)
Happy trading from continuously snowy Boston
Boston
isatrader
Senior member
- Messages
- 2,965
- Likes
- 136
Good post Boston. The emotional swings sum up my week. I’m a long term trader, but I’ve been trying to do some short term trades and am really noticing the ups and downs more. I think a lot of it is the frustration of being stopped out by market noise, when I’m right on the intermediate term direction. Think I’ll dig out my copy of the Taleb book as I bought it a long time ago and have never got round to reading it.
meanreversion
Senior member
- Messages
- 3,398
- Likes
- 538
Ed Seykota (him again) apparently only looks at rates once a day. Makes sense if you're long term trading.
myhedgedfund
Junior member
- Messages
- 39
- Likes
- 1
Why did I go into following trends? Because it took me out of a costly (at least in investing) trait… thinking too much. As Edwin Lefèvre wrote in Reminiscences of a Stock Operator, “It never was my thinking that made the big money for me. It always was my sitting.” I have found that I do best by systematically identifying trends, jumping in, and systematically getting out, without trying to “think” too much. My approach takes advantage of the "Big Trend," which requires patience… it requires me to buy and hold, at least for a while, until the big trend breaks. Jesse Lauriston Livermore (through Edwin in Reminiscences Chapter V) also said:
I don’t try to catch those two eights anymore, which sometimes seems to “cost,” as it actually “did” this week.
Current Positions
The markets were quite active this week, trending mostly down. This activity caused me to get out of 3 out of the existing 31 positions. I sold IYZ (Telecom) with a loss of 3.1%, EZA (South Africa) with a loss of 8.1% and XRT (Retail) with a loss of 4.1%; all three positions had been trending down since the beginning of the year, so the sell signals (triggered by ATR’s and MA’s) were not a surprise. I also added a position in EWY (South Korea) towards the end of the week. You can read about all my current positions in more detail here.
Performance for the week was just about the opposite from Week 2, with the 31-position portfolio losing 4.69 percentage points. The leveraged positions performed poorly, with Russell 2000 (TNA) down ~12%, NASDAQ (TQQQ) down ~7% and Midcaps (MWJ) down ~ 5% for the week.
“My Hedged Fund” performance –
Week - down 4.69%,
YTD - down 0.64%
Total World Stock (ACWI) – YTD - up 1.13%
S&P 500 (SPY) – YTD - up 2.08%
European, Australasian and Far Eastern Markets (EFA) – YTD - up 2.11%
Commodities (GCC) – YTD - up 1.55%
What Next Week May Bring
Small Caps (TNA), Coal (KOL), Metals & Mining (XME) and Transportation (XME) weakened significantly and abruptly during the week. Any prolonged selling early next week may trigger sell signals in them. Several ETF’s continue to flash buy signals, with some of the strongest being Timber (CUT), Technology (XLK), and Semiconductors (SMH). Gold is starting to develop a nice negative trend, I may short it in the next few weeks.
Feedback and commentary are as always welcomed.
Happy trading from Boston,
Boston
“One of the most helpful things that anybody can learn is to give up trying to catch the last eight, or the first. These two are the most expensive eights in the world.”
I don’t try to catch those two eights anymore, which sometimes seems to “cost,” as it actually “did” this week.
Current Positions
The markets were quite active this week, trending mostly down. This activity caused me to get out of 3 out of the existing 31 positions. I sold IYZ (Telecom) with a loss of 3.1%, EZA (South Africa) with a loss of 8.1% and XRT (Retail) with a loss of 4.1%; all three positions had been trending down since the beginning of the year, so the sell signals (triggered by ATR’s and MA’s) were not a surprise. I also added a position in EWY (South Korea) towards the end of the week. You can read about all my current positions in more detail here.
Performance for the week was just about the opposite from Week 2, with the 31-position portfolio losing 4.69 percentage points. The leveraged positions performed poorly, with Russell 2000 (TNA) down ~12%, NASDAQ (TQQQ) down ~7% and Midcaps (MWJ) down ~ 5% for the week.
“My Hedged Fund” performance –
Week - down 4.69%,
YTD - down 0.64%
Total World Stock (ACWI) – YTD - up 1.13%
S&P 500 (SPY) – YTD - up 2.08%
European, Australasian and Far Eastern Markets (EFA) – YTD - up 2.11%
Commodities (GCC) – YTD - up 1.55%
What Next Week May Bring
Small Caps (TNA), Coal (KOL), Metals & Mining (XME) and Transportation (XME) weakened significantly and abruptly during the week. Any prolonged selling early next week may trigger sell signals in them. Several ETF’s continue to flash buy signals, with some of the strongest being Timber (CUT), Technology (XLK), and Semiconductors (SMH). Gold is starting to develop a nice negative trend, I may short it in the next few weeks.
Feedback and commentary are as always welcomed.
Happy trading from Boston,
Boston
meanreversion
Senior member
- Messages
- 3,398
- Likes
- 538
Update pls Boston if you get the time, markets been choppy, thanks.
isatrader
Senior member
- Messages
- 2,965
- Likes
- 136
I think he's only updating it once a week, as is the same as his blog. Here's the link: http://myhedgedfund.typepad.com/my-hedged-fund/
myhedgedfund
Junior member
- Messages
- 39
- Likes
- 1
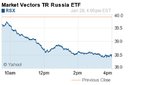
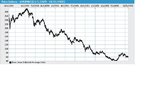
How do we handle volatility in a trend following system? Well of course, it depends. Periods of high volatility create a big opportunity for traders who use short-term trend following systems and can be extremely profitable with proven systems in the right hands. These traders look for periods where trends are quickly formed; profit opportunities abound. The reader of this post no doubt recognizes the similarities between the two charts below; they depict the 1-day (28 January 2011) RSX trend and the 3-year (1929-32) US:INDU trend.


While the correlation may not be 100%, the point should be clear: trends exist in the short term (in the order of hours), the long-term (in the order of years), and in between. Someone following hourly trends becomes by definition a “daily trader” while those following long-term trends could be confused with the “buy and hold” crowd. I personally fall in the “in between” category, where I follow monthly trends which require me to trade on a weekly basis.
Volatility uses – Volatility is very important to me both from a system and mental health perspective. In “Week 2” I outlined (referencing Taleb’s work) some of the reasons why I don’t use a “daily” trend following system, with my lack of ability to profitably handle extreme volatility being key. Long-term trend following systems are of significant value, but the boredom factor (too little volatility?) then rears its head. So I’ve known for quite some time now that I need some volatility in order to succeed as a trader.
How do I use volatility? I have described before how my selection of asset classes are based on simple moving average combinations; volatility uses for me revolve mostly around pyramiding and selling decisions.
- Selling – while I use traditional MA crossovers as selling signals, they are supplemented at times by the use of the Average True Range (ATR), which of course is itself a volatility measure.
- Example – suppose there is a $10 asset (A1) with a 0.10 ATR and another $10 asset (A2) with a 0.20 ATR. A trader who uses a -10ATR sell signal would sell A1 when it reaches $9, while he would do so at $8 for A2. This is an indirect volatility play, which forms a part of my strategy today.
- Pyramiding – how do traders add to their investments? There are many ways. One of the variables I use is the basic Standard Deviation / Price, which is of course a volatility play as well.
Of the readers I ask, what volatility measures do you use? Which ones should I consider using in the ETF trading front?
Current Positions
I chose the volatility topic for a reason; the markets certainly witnessed a significant amount of volatility this week, particularly so towards the end of the week. This volatility caused sell signals for the Malaysia position (2nd block sale will be carried at the open on Monday) and reductions in the Russell 2000 (TNA) position. I added positions on Technology (TYH), Large Cap Growth [NASDAQ (TQQQ)], and a second block on Industrials (XLI).
Those interested could find the details of my current positions here.
Performance for the week was just about flat (up 0.01%), although it had been up over a little over 4% just the day before (volatility at its best.)
“My Hedged Fund” performance – Week - up 0.01%, YTD - down 0.63%
Total World Stock (ACWI) – YTD - up 0.04%
S&P 500 (SPY) – YTD - up 1.57%
European, Australasian and Far Eastern Markets (EFA) – YTD - up 1.22%
Commodities (GCC) – YTD - up 2.03%
What Next Week May Bring
Coal (KOL), Mexico (EWW), Transportation (IYT), Home Construction (ITB) and Consumer Discretionary (XLY) trends are deteriorating; I may see selling signals next week. I may buy into the Dow Jones U.S. Real Estate Index (IYR), MSCI Sweden Index (EWD) or the Swiss Franc (FXF) next week as trends are moving in the right direction at this time; I may add to my Energy (ERX) and Agriculture (DBA) as well.
Feedback and commentary are as always welcomed.
Happy trading from Boston,
Boston
Attachments
meanreversion
Senior member
- Messages
- 3,398
- Likes
- 538
I recently added correlation to S&P daily returns to my backtest code. For a long run (10 years) I get -0.15 or so, which sounds about right. Any idea what your historical correlation is?
isatrader
Senior member
- Messages
- 2,965
- Likes
- 136
Hi Boston, an interesting article again. Do you have a way of measuring your Counterparty Risk? I ask as during the financial crisis in 2008 the ETFs I held from one provider were suspended for a while as the counterparty for them was AIG. The ETF provider have since changed the structure to have multiple counterparties. But I wondered if this was something you considered when looking at the balance of your fund. Do you know how much risk you have with a single bank?
myhedgedfund
Junior member
- Messages
- 39
- Likes
- 1
Hi Boston, an interesting article again. Do you have a way of measuring your Counterparty Risk? I ask as during the financial crisis in 2008 the ETFs I held from one provider were suspended for a while as the counterparty for them was AIG. The ETF provider have since changed the structure to have multiple counterparties. But I wondered if this was something you considered when looking at the balance of your fund. Do you know how much risk you have with a single bank?
Hi Isatrader,
I actually do not have a way to measure it, although would certainly love to learn about how to do so. There are several articles (#1) (#2) that provide some background on the topic of "Counterparty risk" but limited guidance on how to actually measure it. Article #1 above alludes to less risk being present in ETF's backed by actual physical replication of an Index vs "synthetic replication" (through the use of derivatives), but this is still just a qualitative assessment of risk.
Anyone else has thoughts on the topic? Seems like a good Thesis project...
Boston
meanreversion
Senior member
- Messages
- 3,398
- Likes
- 538
Boston, out of interest, why are you so convinced that trend following will continue to work? It has in the past, but as we know, this is no guarantee of future behaviour. Could you explain to us your belief system behind your approach to markets?
myhedgedfund
Junior member
- Messages
- 39
- Likes
- 1
Boston, out of interest, why are you so convinced that trend following will continue to work? It has in the past, but as we know, this is no guarantee of future behaviour. Could you explain to us your belief system behind your approach to markets?
Belief System behind Trend-Following
• History repeats itself – while we tend to use the phrase from a risk management perspective (meaning “don’t ignore the past as it could come back to haunt you”), the opposite is also true… trend-following systems have worked in the past… they should continue to work in the future.
• Price action – a solid trend, confirmed by multiple trend lines, comes across to me as a strong predictor of future performance. Could the trend turn around the minute you buy it? Of course it can, and it does, but the probability is greater that it will continue.
• Case in point – the chart below is that of a major sector taken today, 31 JAN 11. I personally feel very comfortable putting some capital here. Could the trend reverse? Of course, but I find it more likely than not that it will continue.
• Economic growth – I believe that the global economy, in the long-term, will grow; it is the “mother trend.” [One could argue that traditional “buy and hold” investors are following a trend, the difference being that the rationale for those investors in based more on “fundamentals,” while ours is based (or should be based) on price movement alone.] Trend-following is then all about extracting more from the “mother trend” by identifying sub-trends (of the hours, days, months variety) within it and trading them.
It could be argued that these conditions (economic growth, price action, etc) are a reflection of human behavior, and therefore unlike to drastically change, although they will certainly evolve. If one assumes the system is well designed (risk management protocols in place, well diversified and capitalized) and if one assumes discretion is kept to a minimum (kept in place only to address potential evolution in human behavior), then trend-following systems should continue to work, maybe for a while longer.
In the end though, the Earth is flat, GM can never go broke, and a little kid with a mom from Kansas and a dad from Kenya can never be President of the U.S. My eyes are wide open.
Boston
Attachments
meanreversion
Senior member
- Messages
- 3,398
- Likes
- 538
Yes, these are all reasons I've used in the past to justify this style of trading to myself.
Human beings don't change and as such, there will always be trends.
However, I wonder if a little more work needs to be done here. You know your style of trading; is there any evidence to show that the OPPOSITE of your style of trading loses money? If we can show that, then that adds to the argument.
myhedgedfund
Junior member
- Messages
- 39
- Likes
- 1
Week 5 - Shorting ETF’s; theoretically easy to do…
First some background, leveraged from the following sources:
The Basics of shorting ETF’s – as with stocks, shorting an ETF requires that you borrow the shares that you want to sell. The broker may borrow the securities from another client or from another firm, and the ETF is sold on the market. The hope of course is that the market will fall. The decline will cause the price to drop, allowing for the ETF to be repurchased at a lower price.
Advantages of Shorting ETFs:
Disadvantages:
Alternatives:
Why do I bring the topic up? It impacted me this past week of course.
I’ve been watching the deterioration of EPI (India) for some time, creating a very nice trend. All indicators pointed towards a buy signal on the short side, which I received early in the week. I proceeded to place the order, which was “rejected” within a couple of minutes. I tried again, and was rejected again. After trying four times I called the broker directly who indicated that there were no shares available for sale, this with the “short interest” level at almost 4MM! My options were to either keep trying or to drop the interest in the short.
To make a long story short (no pun intended), I was not successful in completing the transaction, opting instead for INDZ, an India inverse (and leveraged) ETF.
Any readers come across similar challenges? What workaround, if any, have you been able to develop?
Current Positions
I completed the following transactions last week:
The pyramiding signals created a need for additional funds; I use a “relative strength” algorithm to prioritize sales in situations such as this. The algorithm considers distance between price and MA’s (the greater the better), distance between price and 52-week highs (the smaller the better), and the ETF’s standard deviation. The algorithm provided prioritized sales on KOL (coal), ITB (home construction) and TNA (Russell 2000); those funds were used to fund the additions listed above.
The reader can see all positions in more detail here.
Current performance
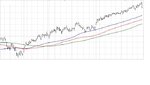
Week 5 was the best week of the year so far, with the fund being up almost 8%. Currently invested in 26 assets, with all but one (biotech) showing gains. ERX has performed particularly well, up 24% YTD. Chart with some relevant benchmarks below:

What Next Week May Bring
Only IBB (biotech) appears to be close to giving a sell signal. All other current investments are in what appear to be solid trends. Current investments in EWC (Canada), EWJ (Japan), EWT (Taiwan), FCG (natural gas exploration), JJG (grains) and NLR (nuclear energy) are close to providing additional pyramiding buy signals which could cause me to sell IAI (broker / dealers), XLY (consumer discretionary) and the aforementioned IBB. Any additions to FCG and NLR would "max them out" as per my risk management guidelines (ERX, MWJ and XLI are already maxed out.)
Feedback and commentary are as always welcomed.
Happy trading from Boston,
Boston
First some background, leveraged from the following sources:
Investopedia - Shorting ETFs: Profit Or Peril?
ETF Trends – Shorting ETFs Without the Risk, and
Index Universe - Shorting ETFs Misunderstood, Even By A Ph.D.
ETF Trends – Shorting ETFs Without the Risk, and
Index Universe - Shorting ETFs Misunderstood, Even By A Ph.D.
The Basics of shorting ETF’s – as with stocks, shorting an ETF requires that you borrow the shares that you want to sell. The broker may borrow the securities from another client or from another firm, and the ETF is sold on the market. The hope of course is that the market will fall. The decline will cause the price to drop, allowing for the ETF to be repurchased at a lower price.
Advantages of Shorting ETFs:
- ETFs are said to be easier to short than stocks because they're not subject to the "uptick" rule, where shares cannot be shorted unless their prices first rise.
- ETF’s also are not affected by short squeezes which occur when the price of the stock starts on a quick rise when the supply is lacking. Traders with short positions try to buy stocks to prevent losses, which only spikes the prices even further, making the losses of those who shorted and didn't close their positions even worse. ETFs don't suffer from this because of the number of shares that can be increased (theoretically) on any trading day.
- ETF’s also are not affected by short squeezes which occur when the price of the stock starts on a quick rise when the supply is lacking. Traders with short positions try to buy stocks to prevent losses, which only spikes the prices even further, making the losses of those who shorted and didn't close their positions even worse. ETFs don't suffer from this because of the number of shares that can be increased (theoretically) on any trading day.
Disadvantages:
- The process can be difficult to execute
- Not all ETFs can be shorted, and some are hard to short, as it is difficult to do so in small quantities.
- Not all ETFs can be shorted, and some are hard to short, as it is difficult to do so in small quantities.
Alternatives:
- Use Inverse ETFs - Some people have gravitated to inverse ETFs, which are also known as short ETFs. They are of course designed to go up when a particular sector or index declines. These ETFs provide all the benefits of short selling, but don't require that you make a direct short sale.
- If there is no 1X inverse available, one could trade half the dollar amount in a 2X inverse
- Open multiple brokerage accounts for your shorts and use these other accounts for the times your primary broker does not have the ETF or stock available.
- If there is no 1X inverse available, one could trade half the dollar amount in a 2X inverse
- Open multiple brokerage accounts for your shorts and use these other accounts for the times your primary broker does not have the ETF or stock available.
Why do I bring the topic up? It impacted me this past week of course.
I’ve been watching the deterioration of EPI (India) for some time, creating a very nice trend. All indicators pointed towards a buy signal on the short side, which I received early in the week. I proceeded to place the order, which was “rejected” within a couple of minutes. I tried again, and was rejected again. After trying four times I called the broker directly who indicated that there were no shares available for sale, this with the “short interest” level at almost 4MM! My options were to either keep trying or to drop the interest in the short.
To make a long story short (no pun intended), I was not successful in completing the transaction, opting instead for INDZ, an India inverse (and leveraged) ETF.
Any readers come across similar challenges? What workaround, if any, have you been able to develop?
Current Positions
I completed the following transactions last week:
- Sold EWM (Malaysia) – completed sale signaled at the end of last week
- Sold IYT (transportation) and EWW (Mexico) after hitting technical thresholds
- Bought INDZ (India short) based on technical thresholds
- Added to FCG (natural gas exploration), XLI (industrials), DBA (agriculture), TMV (treasury bear), and NLR (nuclear energy) after receiving “pyramiding” buy signals.
The pyramiding signals created a need for additional funds; I use a “relative strength” algorithm to prioritize sales in situations such as this. The algorithm considers distance between price and MA’s (the greater the better), distance between price and 52-week highs (the smaller the better), and the ETF’s standard deviation. The algorithm provided prioritized sales on KOL (coal), ITB (home construction) and TNA (Russell 2000); those funds were used to fund the additions listed above.
The reader can see all positions in more detail here.
Current performance
Week 5 was the best week of the year so far, with the fund being up almost 8%. Currently invested in 26 assets, with all but one (biotech) showing gains. ERX has performed particularly well, up 24% YTD. Chart with some relevant benchmarks below:
What Next Week May Bring
Only IBB (biotech) appears to be close to giving a sell signal. All other current investments are in what appear to be solid trends. Current investments in EWC (Canada), EWJ (Japan), EWT (Taiwan), FCG (natural gas exploration), JJG (grains) and NLR (nuclear energy) are close to providing additional pyramiding buy signals which could cause me to sell IAI (broker / dealers), XLY (consumer discretionary) and the aforementioned IBB. Any additions to FCG and NLR would "max them out" as per my risk management guidelines (ERX, MWJ and XLI are already maxed out.)
Feedback and commentary are as always welcomed.
Happy trading from Boston,
Boston