Mt 4 indicators

bwge

Junior member
Messages
41
Likes
4
Please feel free to share any MT4 Indicators that you have used and find it useful
 
Mt4

Some folks might not know you can put MT4 indicators in the same window saving space on the charts, the EURUSD chart here shows stochs (blue/red) cci (yellow) and momentum (white) all in the one window, pretty cool :cool:

Just drag them from the navigator into the same window.:)
 

Attachments

  • mt4.PNG
    mt4.PNG
    46.1 KB · Views: 526
Some folks might not know you can put MT4 indicators in the same window saving space on the charts, the EURUSD chart here shows stochs (blue/red) cci (yellow) and momentum (white) all in the one window, pretty cool :cool:

Just drag them from the navigator into the same window.:)

wow! thats fantastic! - Thanks for sharing

I like your candles, how do you do this ie like the box to b empty as it looks nice on Black background. Clean and simple
 
wow! thats fantastic! - Thanks for sharing

I like your candles, how do you do this ie like the box to b empty as it looks nice on Black background. Clean and simple

Hello, you need to to set your chart up and then save as a template.

Load your chart and right click on it, set up as you see here and then left click the templates icon and select save, you need to give it a name and save.

Each time you open a new chart you can then load this template to give the same settings all on your charts.

Have fun :)
 

Attachments

  • dax settings.PNG
    dax settings.PNG
    29.2 KB · Views: 362
  • daxset2.PNG
    daxset2.PNG
    36.7 KB · Views: 389
Hello, you need to to set your chart up and then save as a template.

Load your chart and right click on it, set up as you see here and then left click the templates icon and select save, you need to give it a name and save.

Each time you open a new chart you can then load this template to give the same settings all on your charts.

Have fun :)

Thanks
 
Stochastic Oscillator and Relative Strength Index

I just developed my own potentially profitable daily charts based on a system I saw (for the first time) last week, described as a Reliable Forex Trend Trading Strategy. It combines use of the Stochastic Oscillator with the Relative Strength Index (RSI), with the underlying idea being to enter positions as price is recovering from retracement (i.e., reversing direction to rejoin the primary trend after pullbacks).

EURJPYDaily.png

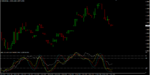
The main chart contains my personal “dynamic trailing support and resistance envelopes,” but in the lower panel I have combined the Stochastic Oscillator and RSI (i.e., matched up their overbought and oversold levels) on which my envelopes’ settings are based, parameters with which I was far more pleased than I might have anticipated. (I am currently waiting for the right day to sell the above pair.)

All of the following comments are just notes I’ve written for myself…

NOTES TO SELF:

Operate in the direction of the primary/main trend
Especially useful when price touches levels of significant support/resistance
Place stop loss above/below significant previous top/bottom

STOCHASTIC OSCILLATOR

%K = position of current close relative to trader defined absolute price range over n (5) days (red line)
%D = 3-day moving average of %K (dotted line)
%K crossing over %D = oncoming change in trend

LOOK FOR…

Divergence:
%K falling while price is still rising and vice versa
Signal: %K crossing over %D
Confirmation: %D exiting “overbought” (80) or “oversold” (20) zone
Additional Confirmation: %D cutting neutral line (50)


THE RELATIVE STRENGTH INDEX (RSI) sets bullish days against bearish days

LOOK FOR…

Divergence: Between price and RSI
Signal: Exit from “overbought” (70) or “oversold” (30) zone
 
Last edited:
Top