The Proof is in the Trading
In my recent TASC article, "The Hunt for Superior Signals - Two Moving Function Hybrids" (September 2005), I recommended that the Moving Slope Rate of Change ("MSROC") be a part of every trader and researcher's toolbox. A quick look at this indicator demonstrates its value:
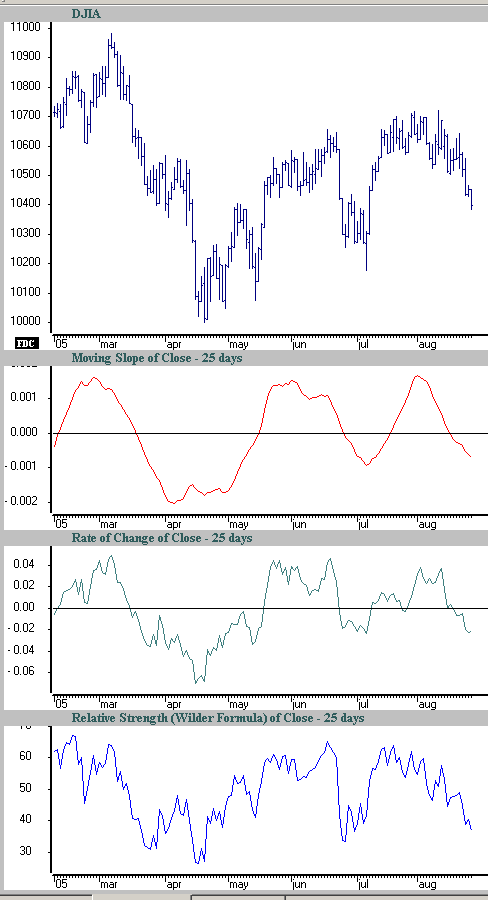
As you can see, the moving slope rate of change is remarkably smooth. Instead of using just a change in price to calculate slope (as with rate of change or "ROC"), we use the slope of a least-squares line to calculate MSROC. [Instructions for MSROC calculation are at the end of the article.] Least-squares lines are notoriously smooth. This smoothness is a major asset, as it minimizes the need for further qualification or subjective input, giving fewer "false signals". For example, from 1993 to early 2005, you would have observed the 25-day ROC of the close of the S&P 500 signaling 1493 changes in direction, whereas the 25-day MSROC signaled only 492 changes in direction.
Graphs look smart and anecdotes make good copy; but the real proof is the trading performance. There was not enough room in the TASC article to present further proof of MSROC's value. Allow me to illustrate a previously-documented trading system and its improvement by switching the signal mechanism from a standard momentum calculation to one using the Moving Slope Rate of Change.
One of the favorite trading systems appearing in newsletters is one in which a 12-month ROC of the NASDAQ Composite is plotted against the 12-month moving average of that ROC. The mechanics of the system are quite simple; a crossover of the 12-month ROC of the NASDAQ Composite close against its 12-month moving average will trigger either a buy (if crossing up) or an exit (if crossing down). Since 1987, this system which was either long or out of the market, had 14 buy signals, 11 of which were winners. That profitability and the fact that the system rules are uncomplicated is the tease. However the system would not be suitable for a professional who has to be mindful of daily drawdowns, as it is based solely on end-of-month data.
That is, the trader is to wake up on the last trading day of the month, make a decision and then fall asleep until the next month-end, regardless of what happens in the interim. Trading the month-end system as proposed is not impossible, but creates huge professional liability. For example, how does a professional trader in a litigious society explain that regardless of what is happening in the world, he can only make decisions and effect trading on the last day of the month? Those same constraints, minus the fear of litigation, affect individual traders as well.
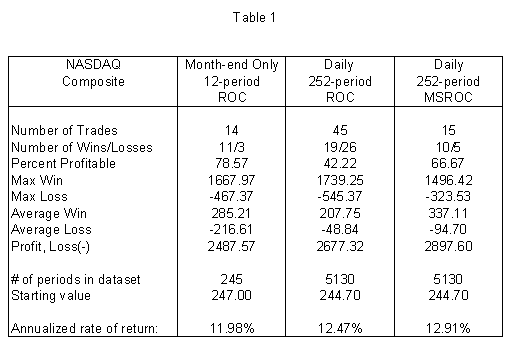
Should one make the documented system realistic by using daily data, one would plot the 252-day ROC against the 252-day moving average of that ROC (since 252 trading days usually constitute a year). You are still comparing an annual rate of change to its annual moving average, but you now see the differences on a daily basis. When viewed in this realistic light, the number of trades increases to 45 and the winning ratio drops from 78 percent to 42 percent. As they say, sometimes realism hurts.
The reason for the poorer performance is that the indicator chosen (rate of change), despite being smoothed with a humongous 252-day moving average, is still erratic. But if you switch from using a 252-day ROC to a 252-day MSROC, you will acquire smoothness while eliminating two-thirds of the trades. That is, by using MSROC you drop down to 15 trades (10 of which are winners) and get to operate the system on a daily basis, and improve your trading statistics practically across the board. Please see the statistics in Table 1.
Testing the month-end ROC system and our two tradable variations (daily ROC and daily MSROC) on the Dow and S&P 500 market indices showed similar improvements. However U.S. stock market indices have high correlations and the fact that a successful NASDAQ trading program also worked for the Dow and the S&P 500 does not prove the system is robust. To gain comfort with our approach we therefore ran the identical systems on other datasets representing a broader sample of market activity. The profitability improvement on all tested datasets constituting a diverse range of markets is presented in Table 2.
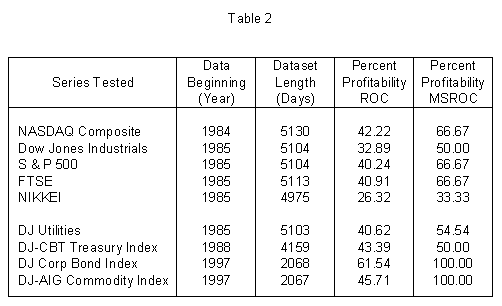
The worst performer here was the NIKKEI, but the proposed strategy was a long-only program, and during the test period the NIKKEI experienced a prolonged downtrend. Note that this example was not anecdotally selected, but a published system that we have improved by a simple change of the yardstick. This author does not recommend the published system, only that a trader enamored with that system consider changing the momentum measuring device to the MSROC.
Now I don't have to tell this trading audience that market prices are fractal. Which means that if a market trading tool works on annual or quarterly data, it most likely works on daily or intraday data also. If you are using rate of change (ROC) or relative strength (RSI) as a momentum tool, you ought to look at using MSROC to improve your results.
Most stand-alone software products (including Excel®) have the ability to fit a linear regression line through say the last 25 closing prices. Calculate the vertical (price) difference between the beginning and ending values of that line, and divide it by the horizontal change (the number of days, i.e. 25). That's the slope of the line for that 25-day period. Divide that slope by the beginning value of the line, and you will make your indicator price-independent. Perform all of the above over successive 25-day periods, and you will make it moving. The price independency makes the MSROC for one market comparable to that of another - which gives you a smooth and timely ranking tool.
In my recent TASC article, "The Hunt for Superior Signals - Two Moving Function Hybrids" (September 2005), I recommended that the Moving Slope Rate of Change ("MSROC") be a part of every trader and researcher's toolbox. A quick look at this indicator demonstrates its value:
As you can see, the moving slope rate of change is remarkably smooth. Instead of using just a change in price to calculate slope (as with rate of change or "ROC"), we use the slope of a least-squares line to calculate MSROC. [Instructions for MSROC calculation are at the end of the article.] Least-squares lines are notoriously smooth. This smoothness is a major asset, as it minimizes the need for further qualification or subjective input, giving fewer "false signals". For example, from 1993 to early 2005, you would have observed the 25-day ROC of the close of the S&P 500 signaling 1493 changes in direction, whereas the 25-day MSROC signaled only 492 changes in direction.
Graphs look smart and anecdotes make good copy; but the real proof is the trading performance. There was not enough room in the TASC article to present further proof of MSROC's value. Allow me to illustrate a previously-documented trading system and its improvement by switching the signal mechanism from a standard momentum calculation to one using the Moving Slope Rate of Change.
One of the favorite trading systems appearing in newsletters is one in which a 12-month ROC of the NASDAQ Composite is plotted against the 12-month moving average of that ROC. The mechanics of the system are quite simple; a crossover of the 12-month ROC of the NASDAQ Composite close against its 12-month moving average will trigger either a buy (if crossing up) or an exit (if crossing down). Since 1987, this system which was either long or out of the market, had 14 buy signals, 11 of which were winners. That profitability and the fact that the system rules are uncomplicated is the tease. However the system would not be suitable for a professional who has to be mindful of daily drawdowns, as it is based solely on end-of-month data.
That is, the trader is to wake up on the last trading day of the month, make a decision and then fall asleep until the next month-end, regardless of what happens in the interim. Trading the month-end system as proposed is not impossible, but creates huge professional liability. For example, how does a professional trader in a litigious society explain that regardless of what is happening in the world, he can only make decisions and effect trading on the last day of the month? Those same constraints, minus the fear of litigation, affect individual traders as well.
Should one make the documented system realistic by using daily data, one would plot the 252-day ROC against the 252-day moving average of that ROC (since 252 trading days usually constitute a year). You are still comparing an annual rate of change to its annual moving average, but you now see the differences on a daily basis. When viewed in this realistic light, the number of trades increases to 45 and the winning ratio drops from 78 percent to 42 percent. As they say, sometimes realism hurts.
The reason for the poorer performance is that the indicator chosen (rate of change), despite being smoothed with a humongous 252-day moving average, is still erratic. But if you switch from using a 252-day ROC to a 252-day MSROC, you will acquire smoothness while eliminating two-thirds of the trades. That is, by using MSROC you drop down to 15 trades (10 of which are winners) and get to operate the system on a daily basis, and improve your trading statistics practically across the board. Please see the statistics in Table 1.
Testing the month-end ROC system and our two tradable variations (daily ROC and daily MSROC) on the Dow and S&P 500 market indices showed similar improvements. However U.S. stock market indices have high correlations and the fact that a successful NASDAQ trading program also worked for the Dow and the S&P 500 does not prove the system is robust. To gain comfort with our approach we therefore ran the identical systems on other datasets representing a broader sample of market activity. The profitability improvement on all tested datasets constituting a diverse range of markets is presented in Table 2.
The worst performer here was the NIKKEI, but the proposed strategy was a long-only program, and during the test period the NIKKEI experienced a prolonged downtrend. Note that this example was not anecdotally selected, but a published system that we have improved by a simple change of the yardstick. This author does not recommend the published system, only that a trader enamored with that system consider changing the momentum measuring device to the MSROC.
Now I don't have to tell this trading audience that market prices are fractal. Which means that if a market trading tool works on annual or quarterly data, it most likely works on daily or intraday data also. If you are using rate of change (ROC) or relative strength (RSI) as a momentum tool, you ought to look at using MSROC to improve your results.
Most stand-alone software products (including Excel®) have the ability to fit a linear regression line through say the last 25 closing prices. Calculate the vertical (price) difference between the beginning and ending values of that line, and divide it by the horizontal change (the number of days, i.e. 25). That's the slope of the line for that 25-day period. Divide that slope by the beginning value of the line, and you will make your indicator price-independent. Perform all of the above over successive 25-day periods, and you will make it moving. The price independency makes the MSROC for one market comparable to that of another - which gives you a smooth and timely ranking tool.
Last edited by a moderator: