Monet Carlo Simulation

Grey1

Senior member
Messages
2,190
Likes
202
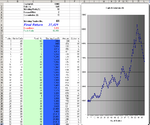
This EXCEL program should shed some light on reward/Risk/pos size/Equity curve and many more..

Risk % is the percent of your total capital you are using in each trade

Win prob is your strategy .. Dont kid yourself most traders have less that 50% system.. I sugges you use 40% for your strategy ..

Reward/risk // lets say your stop is 10 points on DOW then your exit must be 20 points to give you a 20/10 = 2 of reward/Risk

Once you have filled all cells then keep clicking on F9 to see the effect of your inputs on your capital ..

You will learn a lot by just playing with this EXCEL prog..
 

Attachments

  • fast monetcarlo.xls
    54 KB · Views: 103
A salutary lesson for all those who would attempt to trade with too large a proportion of their capital. It should be compulsory to spend a long time with this spreadsheet before trading real money.

Would anyone like to comment on how this sheet could be amended to take account of leverage and commissions as so many members use spread betting as a trading vehicle.
 
Rog,
As soon as we get few more members there will be more contribution from others ..

I will later post few other EXCEL programs to shed a lot of light on various trading concepts.

regards
 
It's interesting to see that even with this random generated chart that there are areas of S/R, wedges, pennants, flags and 5/3 wave rallies and pullbacks which reflect underlying investor psychology. Hmmmm!
 
LOL RogerM - I Thought it was just me!! :LOL:
Without a word of a lie, I found a H&S pattern in mine :eek:

It's easy to explain why you get areas of resistance, as your equity breaks into new highs and you start to change the way you trade to keep this new found wealth.
This theory falls apart when you realise this is computer generated :rolleyes:
 
There are some shockers here. Look at this for instance - one run of 12 losses and then another of 14

Some of the the assumptions are a little unrealistic tho
Capital £10k
Risk 0.05%
Winning Prob 40
R/R 2.5
Commission £3
Winning trades 29
Final Return £7974
Drawdown £3918
Peak Gain £16413
 

Attachments

  • doc1.doc
    473.5 KB · Views: 51
Rog,

You are using the EXCEL prog exactly the way I thought one should be ...

Some shockers heyyyyyyy..

So what is the conclusion ?

Either better strategy or
let the profit run longer

Does it make sence to let the profit run ? yes it does but fear takes over and traders get out too soon .. Alternatively we have to have a better Strategy and take profit quicker..


regards
 
Grey1
I think that in the example I came across several things came out of it for me
1 I have not look at enough worst case scenarios yet
2 The simulation is based on 100 trades and this is not enough
3 It is essential to be very disciplined about levels of risk and reward before taking a trade

I'll continue to tweak and look at setting up some sims in IRT and will post back idc

FTESEB & RM
Try using the sheet with a radar chart as I have posted and you'll start going in circles ;)
 
ROG,

Click on F9and you get more simulation you can have 1000's runs
 
According to the program I downloaded 5% leaves no survivors without high probability & unsurvivable drawdowns Paul. I am probably making some mistake in its use
Ron

Grey1
I have made many runs and assume that figs in brackets are negative?
 
This is what you should be getting ..

The 5% pos size in each trade is shown as £500.. and is 0.05..

A few run of the program should give you a good idea on how to trade ( take profit , Pos size ) to increase your equity in a long term.

The 100 run of the simulation shows that with a 50/50 system you might only get 44 wins which is more realistic than 1000 0000 runs which would have theoretically given you a 50 win 50 loss scenario

As we are day traders we cann't rely on too many samples .. We need to know the worse case scenario in short term than long term ..

The whole idea of this program is to convince you that there is only two choices to have a positive equity curve.

1) have a better than average strategy which exit fast (to give a say R/R of 1 or even 1.5 ) .. So it does not rely heavily on exit and great profit runs

2) have a poorer strategy which heavily relies on exit because it needs to have a High R/R ( say 3 or more ) to keep the equity curve in positive territory.


I hope I am clear here because this is VERY important issue in Trading ..

NO 1 supports the design of an oscillator based system where as NO 2 supports a trend following system ..
 

Attachments

  • mcs1.png
    mcs1.png
    40.8 KB · Views: 136
Last edited:
Guys If I amnot clear pls do say so.. I donot mind explaining .. No mater howmany times . I rather to establish a solid foundation for our further progress than a dodgy one :p
 
Grey1
"NO 1 supports the design of an oscillator based system where as NO 2 supports a trend following system .."
A flash of lightning for me.
Question. The market is in trend about 20% of the time - but in what time frames?
 
Gray 1

This spreadsheet illustrates perfectly that even in a random market by imposing a risk template we can profit.
 
very interesting Grey 1

How is the "risk" part defined exactly ?

Is 0.05 or 5% (£500) the size of the stop excluding slippage ?

given that often you can have a loss that is smaller than the full stop size after raising it and sometimes you have slippage to a bigger loss - would you assume that evens out ?

many thanks
 
DAX,

if you are SB then the % has to be your stoploss.. Th EXCEL program is a demonstration of equity curve under various Win/Loss and reward/risk ratios.


Regadrs
 
I don't have Excel but have the Excel97/2000 viewer.is there an easy way to run the spreadsheet?I have Works 6 spreadsheet so if anyone could tell me which calcs to do,I could run it in that?(If this is clogging the thread,just delete it)
 
Top