Right, in between watching England finish off the Aussies and waiting for my stew to cook, I'll put some flesh on the bones of what I'm trying to test.
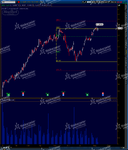
The easiest way to give you an idea is to put up a chart of the kind of setup I'm looking for:
Basically, I'm fading moves that breach into new highs. The setup should be as "clean" as possible, and - as yet - I'm not looking at any of the action as it goes through the level. I have seen moves like this hundreds and hundreds of times, and I am just playiing with the criteria so far.
I said that I am testing something of a hypothesis, and that is the premise that stocks (anything) where the mkt is positioned too long (short) won't go higher (lower) with any gusto. I'm not explaining it very well but I hope you get the gist.
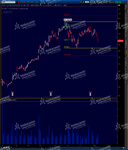
For example, looking at the chart of HRL I have attached, my hypothesis is that the stock will go lower more aggressively that it will go higher. There will be longs that are trapped, and if these are squeezed, the stock could start to shift.
It's this basic idea that I'm looking to test. Because I don't want to say whether the stock will or will not go up or down, I'm hedging the beta. If I've lined my ducks up properly, the "alpha" in this strategy will be picking stocks who move faster in one direction than the other, and positioning accordingly. Then just let the mkt do what it does.
The retracement levels on the chart are simple +/- 25% of the marked range. I'll close the position if the stock extends to +25% of the marked range, and take profits if it drops 75% - so for HRL, my entry is 43.2, STOP 44.64, TGT 38.9. I will also close any residual Beta simultaneously.
I'll look through some charts to show various setups and trades I'm looking to capture, and do my best to answer questions.


