While each region and country has a unique economy, given the volume of international trade, those individual economies are part of a larger global economy. The U.S. economy is the largest in the world but, more importantly for this analysis, it is also the last market traded on the daily clock. This allows U.S. investors a glimpse at how the Asian and European markets are trading before the U.S. stock market opens.
By the time the U.S. market opens, Asian markets are closed and European markets are heading into their afternoon session. Watching the results of these markets can frequently give us a clue as to how the U.S. market will trade. Is the world Bullish? Bearish? Neutral? There is empirical evidence that world investor sentiment can influence the U.S market. And being the world’s largest economy, the U.S market in turn has influence on the open of those world markets the next trading day.
Each region tends to influence the next region trading on the world clock. Catalysts (economic data, for example) within each region help determine the local sentiment. These catalysts can change or reinforce the direction of investor sentiment. Imagine sentiment as a relay race with catalysts being the baton that is passed.
Strategy for Assessing World Sentiment
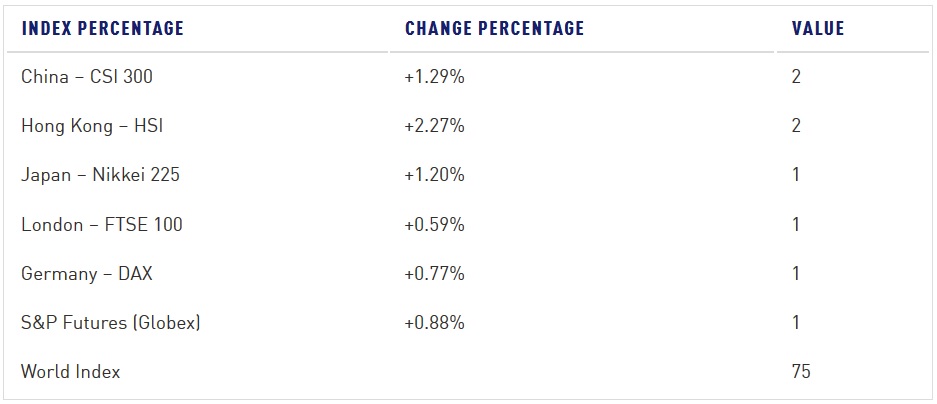
Many years ago, I developed a simple filter for world sentiment, which I call the World Index. The foundation of the World Index is the daily cash market percentage change of the major Asian and European indices along with the U.S. futures percentage change of the S&P 500 index leading into the U.S market open.
The formula for the World Index is simple and provides a variable yet clear indication of market sentiment. The output of the formula is an oscillator that ranges from -100 (extreme bearishness) to +100 (extreme bullishness). A reading of zero signifies neutral sentiment. Therefore, the higher above zero the more bullish, the lower below zero the more bearish.
The World Index is easily determined using a calculator or spreadsheet. Here are the input value rules:
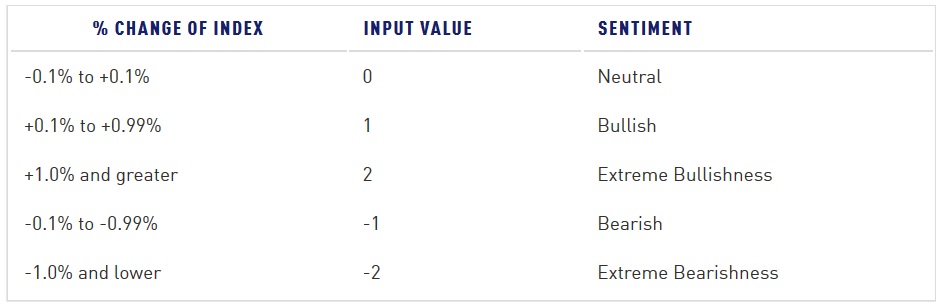
The input values are captured for each major world market, summed, divided by 12 (the maximum input value sum) and multiplied by 100 resulting in the oscillator value ranging between -100 and +100. A more elegant formula would to combine the sum and divide functions resulting in a divisor of 0.12 (12 / 100).
Here’s a recent example suggesting a very bullish sentiment:
I’ve found these markets to be reliable, however, the formula could be customized to include additional indexes. If additional indexes are added, the divisor in the formula would be altered to reflect those additions. For example, for each one added, you would increase the divisor by 0.02. So, if adding one index you would calculate the ultimate World Index value by summing and dividing by 0.14, if adding two markets you would use 0.16, etc.
As a day trader of the S&P Futures contract I’ve used this as a guide for determining directional edge for the coming market day in the U.S. Having captured the World Index daily for several years over thousands of trades, I now have a data set which can be analyzed for a potential edge in trading. Keep in mind that this information is just as useful for stock, ETF and options traders, as the S&P 500 is comprised of the 500 largest publicly traded companies.
No indicator or filter is infallible, so this edge is used to start the trading day with a directional bias. However, live market action and any catalysts that are changing the directional edge take precedence as the current day unfolds.
Let’s get you started with some empirical evidence taken from over 3000 S&P futures trades:
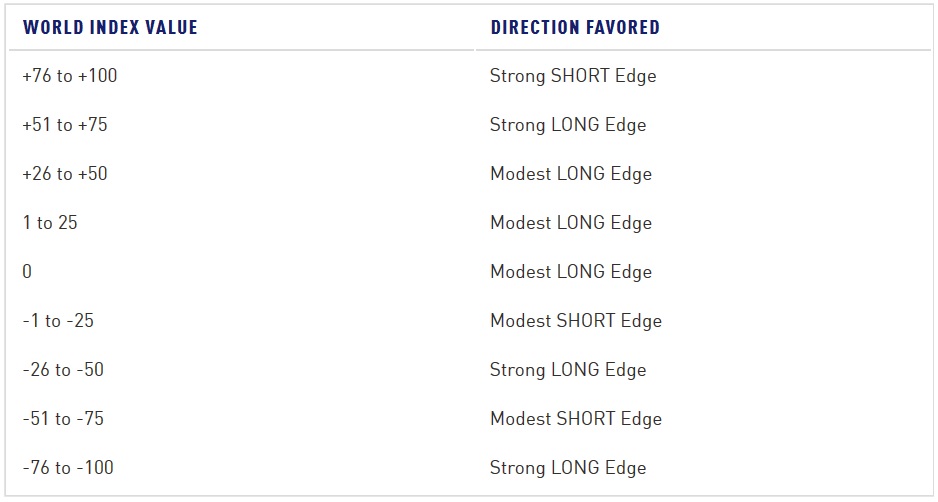
The most notable outcomes are the extreme readings of the World Index. Extreme bullishness has the potential to offer shorting opportunities. As well, extreme bearishness has the potential to offer long opportunities. Though this is not a decision making tool, when used in combination with supply and demand strategies, it can offer additional insights into the movement of the markets.
Mike Siewruk can be contacted on this link: Mike Siewruk