June 30, 2026
As we close out the first half of 2026, financial markets are navigating a complex landscape of shifting monetary policy expectations, geopolitical tensions, and diverging asset class performance. The US dollar remains in a dominant position, gold is testing critical support, oil is swinging on headline risk, and Japanese equities are pulling back from record highs.
Here's what traders need to know as we enter July.
What's supporting the dollar?
Why is gold under pressure?
What's supporting oil?
Why is Japan correcting?
Three narratives driving markets this week:
As we close out the first half of 2026, financial markets are navigating a complex landscape of shifting monetary policy expectations, geopolitical tensions, and diverging asset class performance. The US dollar remains in a dominant position, gold is testing critical support, oil is swinging on headline risk, and Japanese equities are pulling back from record highs.
Here's what traders need to know as we enter July.
US Dollar – Bullish Pause, Not a Reversal
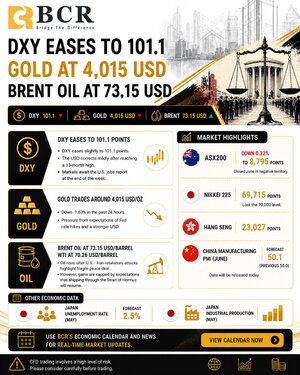
The US Dollar Index (DXY) eased slightly to 101.1 after hitting a 13‑month high last week. This is not a trend reversal – it's a healthy pause after a strong rally.What's supporting the dollar?
- Markets are pricing in an 80% probability of a Fed rate hike by December.
- Hawkish signals from Fed Chair Kevin Warsh continue to support rate expectations.
- US economic data remains resilient, reinforcing the "American exceptionalism" narrative.
- A softer-than-expected Nonfarm Payrolls report this Friday.
- Cooling inflation data that reduces the urgency for rate hikes.
- Progress in US‑Iran peace talks that lowers geopolitical risk.
- Support: 100.94 (9‑day MA) → 100.00 (psychological level)
- Resistance: 101.80 (recent high) → 102.00 (round number)
Gold – Testing Critical Support Below $4,000
Gold has broken below the psychological $4,000 level, trading near $4,015/oz, down 1.63% in the past 24 hours. The metal hit a seven‑month low of $3,959 last week.Why is gold under pressure?
- Strong dollar – makes gold more expensive for foreign buyers.
- Fading inflation fears – falling oil prices reduce the need for inflation hedges.
- Rate hike expectations – higher yields increase the opportunity cost of holding gold.
- Easing geopolitical risk – US‑Iran peace progress reduces safe‑haven demand.
- Support: $4,000 (psychological) → $3,959 (recent low) → $3,900
- Resistance: $4,083 (5‑day MA) → $4,150 → $4,220
Oil – Geopolitical Volatility Returns
Crude oil prices are showing resilience after recent declines. Brent crude is trading at $73.15/bbl, while WTI is at $70.26/bbl.What's supporting oil?
- Fresh US‑Iran retaliatory strikes show the peace deal remains fragile.
- A recent attack on a commercial vessel near the Strait of Hormuz heightened supply concerns.
- Oversold technical conditions triggered a bounce from $68.80.
- Expectations of recovering tanker traffic through the Strait of Hormuz.
- Market pricing of increased Iranian oil supply if the peace deal holds.
- Global demand concerns amid slowing manufacturing data.
- Support: $68.80 (recent low) → $67.00 → $65.00
- Resistance: $73.05 (200‑day MA) → $74.27 (last week's high)
Japan Stocks – Correction from Record Highs
The Nikkei 225 has lost the 70,000 level, closing at 69,715. The index is down from its record high of 72,354.Why is Japan correcting?
- Overbought conditions – RSI was above 70, signaling stretched valuations.
- Profit‑taking – after a 5% surge to record highs.
- Global tech weakness – AI and semiconductor stocks pulling back.
- Uncertainty – ahead of US jobs data and Bank of Japan policy signals.
- Support: 68,000 → 67,000 (psychological level)
- Resistance: 70,000 (key level) → 72,500 (recent high)
Key Data to Watch This Week
| Date | Event | Impact |
| June 30 | China Manufacturing PMI | AUD / commodity currencies |
| June 30 | US Chicago PMI | USD / risk sentiment |
| July 1 | EU HICP Inflation | EUR |
| July 1 | US JOLTS Job Openings | USD |
| July 2 | US Nonfarm Payrolls (NFP) | Major event – USD, gold, equities |
| July 2 | US Initial Jobless Claims | USD |
| July 3 | EU HCOB Services PMI | EUR |
Three narratives driving markets this week:
- Hawkish Fed – supporting the dollar, pressuring gold.
- Geopolitical uncertainty – keeping oil volatile.
- US jobs data – the key catalyst for direction.
- Gold: Bearish below $4,000. Wait for clear reversal signals.
- Oil: Volatile with downside bias. Sell rallies near resistance.
- Dollar: Bullish above 100.00. Buy dips.
- Japan stocks: Bullish but correcting. Buy pullbacks to key support.