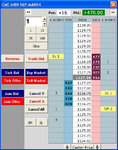
market depth

73sand

Junior member
Messages
32
Likes
0
Market depth show the number of orders on the bid and the ask. So if the bid on ES shows 115 does that mean there are 115 buy orders in the market for which you can sell into or the number of sell orders in the market is 115 and you are joining this cue to sell. From watching the market depth it seems price moves with the bid or ask that has the greatest size.Is cumulative size and average price of any use?

Simon
 
No orders can and are pulled...

I.e. the depth you see aint necessarily there unless you can trade 1000s of contracts in an instance to hit it.

JonnyT
 
73sand said:
Market depth show the number of orders on the bid and the ask. So if the bid on ES shows 115 does that mean there are 115 buy orders in the market for which you can sell into or ... ..............


This means at the moment the data were sent to you there have been order(s) for 115 contracts to buy at this limit. It does not mean these are the only buy orders: buyers may buy at the ask (usually a tick higher than the bid) or use "market"order. That is, in the case of Globex, use a limit above the market. These will be treated as "market"orders and have priority over the limit orders (with a lower limit). Only orders which cannot be filled immediately will be written to the order book.

Bids, like offers, may be pulled any time. And very often games are being played with the Market Depth. That is large offers are used to make people think market will not rise or even drop. Then this offer is pulled and the market does rise, fuelled by the panic buys of those who went short when they saw the large offer.

Using the Market Depth to support your trading decisions will take a long time to learn (think in months) . You have to decide yourself, whether it is worth this effort.

E.g. try this method (it is neither simple to learn nor to apply): watch where the big blocks go: bid or ask. Big depends on volume of the day, time of day and means something between 10, ..50 or more. Say the big blocks generally go on the ask: does the market follow up or not? Usually it goes up, but if it doesn't, well that is interesting info too. This may be most interesting when the market is at a swing high/low.

Regards

Bernd Kuerbs
 
On the bid we have limit orders in the market to buy from which you can sell and vice versa for the ask.
So greater size on the bid is a indication of weakness unless order games are being played in which case if no movement in price comes with the bid size it is as Bernd says also interesting.Market data for the dax on I.B. is 8 euros and dax level 2 to get DOM is 12 euros ,does this mean it costs 20 euros to get dax DOM or can you just subscribe to the dax level 2 at 12 euros.

Simon
 
73sand said:
.....Market data for the dax on I.B. is 8 euros and dax level 2 to get DOM is 12 euros ,does this mean it costs 20 euros to get dax DOM or can you just subscribe to the dax level 2 at 12 euros.

Simon

You pay 12€ and get the DOM for any Eurex traded instrument. Though your TWS will be limited to the simultaneous display of 3 Market Depths. MD is limited to the best 5 bid/ask levels. Other brokers/trading Software may display 10 levels.

Regards

Bernd Kuerbs
 
73sand said:
So greater size on the bid is a indication of weakness unless order games are being played
Providing no 'games are being played', greater size on the Bid indicates strength. More people want to Buy than want to Sell. Demand is greater than Supply.
 
Depth of Market

If the orders are building up on the bid , there are a lot of passive buyers waiting to buy at their price, at this point no urgency in the move. But the aggressive buyers wanting to get in NOW are hitting the ask.

If the t+s starts to show volume appearing on the ASK but not on the bid, get ready for upward movement.
The orders on the bid will then have to start increasing their BIDS. closing the spread . As the offers on the
ASK dry up the next level on the DOM starts to be transacted against. and if the spread is negligible those passive buyers on the bid say 'what the hell' and hit the ask. All contributing to a move upwards with momentum.

Then as the interest in buying the stock wains the t+s shows less and less going off on the ASK, and that
passive buyer is ripe to be hit buy the holders of the stock. But by now the big bid orders have dried up, unless they think the price is still going to go higher. So more and more orders are hitting the bid as active sellers want to get out. the bids fall down a level at a time until there are enough passive buyers with orders, maybe at a resistance level ,ready to take the stock off the hands of the sellers in their view ready for a move upwards again and so the cycle turns.
I find watching the archipelago BOOK useful as it is less cluttered and doesn't have as many old quotes sitting there (I use Qcharts), but it does give a good indication of the amount of orders sitting at various levels.

Hope this helps and isnt too confusing. but I do find depth of market useful with t+s.
Its how you look at DOM which gives the story and I think the active and passive trader is a good way to view , because you can attribute a mindset/emotion which you will have experienced yourself.

Cheers

Triplepack
 
Triplepack,

If the t+s starts to show volume appearing on the ASK but not on the bid, get ready for upward movement.

This is not always the case as you can get a key MM sat on the inside Ask with a size of 1 who will unload thousands of shares (all showing green on T&S). As soon as anyone moves ahead of them with size they lower their Ask to ensure that they continue to be the main person transacting. This will still show trades going off at the Ask but I have seen this happen with the price dropping quite a distance.


Paul
 
Hi Paul,

Yes I agree with you, and t+s shows this as the mm is sitting there rock steady with large volume going off at his price, and if if there is no movement it can be concluded that as you say they are happy to pore stock/supply into the market which will give a resistance level on the chart.

I've seen this happen a few times in my short experience , so reading the situation at that moment/moments in time gives you the clues to wait for him to offload and look to see if the buying interest is still there and watch to see if the trades carry on, then move up as described earlier. If there is sentiment for a move up ,once past this resistance the dynamics change again.

Or as you say he can keep shovelling the stock into the market giving an oversupply of stock leading to a drop in demand and drop in price.

It is as you, Naz and Mr Charts have often said in the past, it isn't only at this moment in time that you get the story , it is the unfolding of the picture over time , be it 30 secs or 30 mins.

You mention the trades going off with green indications on the t+s are these the ones with the TRADE indicator alongside as opposed to the pacx,cinn,nasdaq incators. These appear when a move is about to happen up or down green or red. Do you have any other experiences or nuances you've picked up with these Paul?

Interesting topic.

Cheers

Triplepack
 
Not sure about stocks, but with futures the market tends to trade towards size.

So for example if you see 150 bid @ 68 (big in dax), the market will tend to trade down to it and sometimes through it before it goes back up or continues down

ie size acts like a magnet.
 
So you think market depth on the Dax is a good guide as to where price is going?

Simon
 
Not on a longer term basis, but say you are short and the market is approaching a level where you want to get out but seems to be stalling, if you see big size down there I think thats an indication that it will go there, so rather than exiting early i'll wait.
 
good example being just now 3894 and 3898 at 15.20 ish, market heavily offered around mondays low 500 lots 4 ticks up.
 
Did market depth help today on the dax at 10:15 when you might have expected support at 3869 but gapped down to 3865.5before recovering.

simon
 
Dom, Dax

I'd like to know more more on this.

Using the attached file as an example, perhaps we could have a commentary on the significance of quantity, price, levels. Hopefully, we'll also get various interpretations.

Re DAX, who provides the greatest depth of market? A quote vendor or execution platform (this was absent when I used TWS)?. Presumably Eurex would have the maximum but is sight of the total (futures) order book a prerogative of clearing members?
 

Attachments

  • Order book.jpg
    Order book.jpg
    143.8 KB · Views: 1,882
Grant said:
I'd like to know more more on this.

Using the attached file as an example, perhaps we could have a commentary on the significance of quantity, price, levels. Hopefully, we'll also get various interpretations.

Re DAX, who provides the greatest depth of market? A quote vendor or execution platform (this was absent when I used TWS)?. Presumably Eurex would have the maximum but is sight of the total (futures) order book a prerogative of clearing members?


TWS will provide the five best bid/ask levels. J-Trader /TT-Trader offer up to 10 levels, seems to depend upon the broker. I do not know, what the member data feed for Eurex will show.

As to the screen shot: it does not make sense to try to interpret a single snapshot. The order book is a dynamic thing, think of it as a film. A single picture will not give you much of an idea about the scene you are in. It is difficult to show examples, you would have to make a film of the DOM. There are tools for this, but my old laptop is not up to this job.

An example of Thursday, DOM of ES: At one moment the inside bid dropped to a figure in the teens (around 40). This may happen, and is more due to the snapshot nature of the order book than anything else. The other levels did display sizes of around 1500 - 2000 contracts. But on this occasion, the size did not snap back to the usual number, the size stayed in the teens for some seconds. Conclusion: an aggressive seller was hitting the bids, selling to them as they entered the market. The market dropped for a few ticks then.

In your screen shot, I'm missing the cumulated bid/offer, the sum of all contracts for the bid/ask. Seems to be around 2000 for both sides in your example. I also do not see the size of the last trade and where it took place?

Have a nice weekend

Bernd Kuerbs
 
Dom

Bernd,

It's a start.

The following may be of interest (plus 30-day trial) though I can't vouch for validity: www.marketdelta.com. Look at the "Software components" section. and also the whitepaper.

Attached is a paper regarding order flow.
 

Attachments

  • Trade by the Book.doc
    32.5 KB · Views: 3,833
Last edited:
Top