Main STOCK correction over?

de123

Active member
Messages
120
Likes
2
Just qurious, if anybody here think the big puullback is over, or does think that housing markets in US will get us in recesion later on,...

What about sell on May and go away?...was may on january?

and the dolar , is he gona get the strenght when they lower rates...

i know anythink could happen....

thanks
 
looks like no lower lows,...according to yesterday trading,...so its officially over to me...rgrds
 
de123 said:
looks like no lower lows,...according to yesterday trading,...so its officially over to me...rgrds

correction over ?

Who knows but........if you're right then dow has 600+ points to go.......

Whatever happens after yesterday's move there's a few "mispriced" stox in europe today :LOL:
 
Within the context of your query regarding 'main stocks' and therefore the averages, the underlying technicals indicate a potential loss of 25% from Highs before 07Q4.
 
im aiming @ energy stocks, like ptr, snp, pbr,...but think its an overall opinion,....didnt check others
 
de123 said:
looks like no lower lows,...according to yesterday trading,...so its officially over to me...rgrds

I don't necessarily investment in all lower cost stocks, but I have one account dedcated to $1 to $2 stocks that seems to move opposite from the major indexes. i.e. when the DOW is down $90, many of these low cost stocks start moving up. It seems like large cap money is being dumped into these low priced stocks after they've been beaten down 10% to 20%.

Enlightened
 
interesting what was happening in last year at this time, will the history repeat itself,..and we have a bull run,..or is this TRUE a bad times for LONGS in stocks, only time will tell...
 
interesting what was happening in last year at this time, will the history repeat itself,..and we have a bull run,..or is this TRUE a bad times for LONGS in stocks, only time will tell...


We have at least another major leg down to test the JAN low,,, after that there could be a long term consolidation before it moves down further

All stocks are subject to major correction as a result of market correction ,,

Is this the END ? NO
is this the bottom ? No
is this the good time to short? No wait for a spike to above and then short fundamentally WEAK stocks
is there any catalysts such as further interest rate cut to save the market ? Nope the interest rate cut should only spike up but the trend is down and shall continue down for at least next 6 month .
is there any buying opportunities in the market ? There might be fantastic stocks there but WAIT a bit longer you might get them 20% cheaper

NO BEAR MARKET EVER LOOKED LIKE A BEAR MARKET AND THIS ONE IS NOT ANY DIFFERENT EITHER

Grey1
 
Last edited:
Unfortunately ,I cannot recall the correct attribution,but this is not mine simply something anyone interested in stock buying should 'bear' in mind :

"the essence of a bear market is it offers HOPE all the way down".
 
interesting what was happening in last year at this time, will the history repeat itself,..and we have a bull run,..or is this TRUE a bad times for LONGS in stocks, only time will tell...

The context is entirely different. You were in an uptrend and nowhere near breaking it, plus you bounced off major support, just like August. Now the uptrend that began in '06 has been broken and you've fallen below tha last important swing low ( longer-term uptrend is still in place).
 
Some people (Grey 1 and DBP) with a great deal of experience took the time and trouble to give your question serious consideration. In return you with what passes for solid concrete ear to ear use it as a means to appear 'clever'.It appears their comments completely passed you by because you were not listening ,it was simply more important to show the forum how intelligent you are. :LOL: I was going post chart explaining the longer term action as a framework for the comments already made ,but having read your comment...you can get stuffed ....and yes, LOL
 
Some people (Grey 1 and DBP) with a great deal of experience took the time and trouble to give your question serious consideration. In return you with what passes for solid concrete ear to ear use it as a means to appear 'clever'.It appears their comments completely passed you by because you were not listening ,it was simply more important to show the forum how intelligent you are. :LOL: I was going post chart explaining the longer term action as a framework for the comments already made ,but having read your comment...you can get stuffed ....and yes, LOL

Please post the chart - I'm sure many are interested.

UTB
 
Apologies Blade ,had not seen your post . No problem ,if you think peeps might like to see a view (I said a view).

First ,qualifiers ,this is the Ftse100 ,I don't follow the US for trading purposes as I prefer 'free market activity'. I'm very aware of it for economic releases / events though.Second, this is a structure ,or framework that in a sense reflects my 'current' view ,or expectation for a market that is deleaveraging. I'll gladly change that view if the price actvity warrants it. At this time it does not .

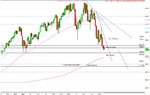
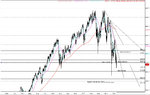
The chart is weekly ,but the averages belong on a daily chart..they are 21 / 63 / 252 which equate to a trend for activity over a month ,quarter and year.Interesting thing is when you put them straight onto a higher timeframe chart without changing them to 4 / 13 and 50 you still get the basic idea of a market trending down.

S and R are close enough without bothering about the odd point or 20. On a weekly chart pinpoint accuracy is relative ;)
Interestingly some of these 'lines' have been in place for quite some time ,they have not been filled in as we go along. I've got some trend lines drawn that are potential for the future..will either be confirmed ,or erased as not valid.

The double top target is stated as initial because typically it 's more a place for a prior trend to lose momentum than to signify any concrete low. Fully expect if that target is reached that the 'forlorn hope' brigade (nicknamed after the British army group who always had to be first in the breach rarely surviving the action) will attempt to a new range low below that target.

Would that be an end to trend...absolutely no idea ..if what's on that chart came close to mirroring actual action I'd be more than satisfied ...I'm amazed by people who try to map the future even further out ..would you trade or invest that ?
 
Last edited:
The chart.
 

Attachments

  • FTSE 100.jpg
    FTSE 100.jpg
    166.5 KB · Views: 174
Just out of interest I've squashed the daily up a bit for you to show the same picture.
 

Attachments

  • Ftse 100 daily.jpg
    Ftse 100 daily.jpg
    155.4 KB · Views: 178
Regardless of multi stories about contrary sentiment signifying a 'bottom' etc ...I have still not seen anything on the charts that tells me this is so..that in fact the rallies are anything more than clearing rallies afterall it's spec money bottom picking that let's a 'trapped' investor get out ;) ...I'm not married to this idea ,but I still see little to buy for investment purposes and several sectors that are obviously trying rally/stabilise having had the 'crap' kicked out of them ,but would I want them as an investment ?..no,
so far they have suffered on anticipation of a slowdown and earnings impact ,BUT they have yet to actually experience it (job losses etc etc)..with that still to come I think we are just seeing bottom picking specs and yield chasers (oh hello what was 600p now
450p must be cheap with that yield must it not ?) ...intermediate range in a downtrend..that I'd accept.

How do you have an economic bottom without virtually any of the economic 'pain' ...somebody give me a data driven convincing argument on that question and I might turn my chart upside down and see something different....and that would have to mean a hell of lot more than some intraday spike yet to be taken out therefore must be a market support line ..LOL ...as my daughter say's to me ..yeah right !
 
Top