pedro01
Guest
- Messages
- 1,058
- Likes
- 150
OK - this will get a little dull for a few posts but there's a few more scenarios we need to throw at AIM.
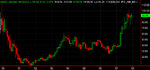
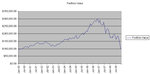
A slightly shorter period as I want to test an 'n' shape price curve - again with price ending up where it started.

Again - a market going nowhere.
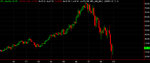
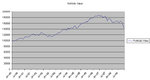
Buy and Hold:

Initial Investment : $100,000
End Num Shares : 3703
End Value : $96,389.09
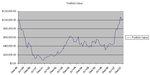
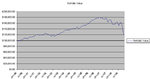
AIM

Initial Investment : $100,000
End Num Shares :3,446
End Value Shares : $89,699.38
End Value Cash : $27,817.80
End Portfolio Value : $117,517.18
The point here is to see if AIM is robust. Thus far AIM has...
- reduced the return on an market that goes straight up
- increased the return on different types of market that end up where they started.
Note that I don't intend to buy anything that ends up where it started - it's just a test.
Also note that AIM is tunable. The initial % in cash is 50% in the original version. Portfolio control adjustment is 50% of any purchases. There are some 'improvements' on AIM that came later & those MAY be tested too.
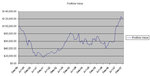
For instance, you you adjust the safe pct from 10 to 50%, the above AIM results now look like this :

Initial Investment : $100,000
End Num Shares :2,292
End Value Shares : $59,660.76
End Value Cash : $82,437.71
End Portfolio Value : $142,098.47
So - for now, I'm not going to dick around with the parameters for AIM. It can be done, it will affect results but it is a variable that needs to be tested later IMO...
Also - as expectations can affect results, I'd better tell you where I think this is heading:
1 - AIM may actually conflict with Asset Allocation strategy that also dictates when you buy/sell (on re-balancing)
2 - If spreading the risk across 5 or 6 non correlated asset classes, you probably don't need to put away 50% of the entire portfolio in the cash account at the outset. As the asset classes are not correlated, some markets should be adding to the cash account whilst another is drawing on it.
3 - obviously there are times, as we saw earlier this year, where many, if not all asset classes can be correlated.
A slightly shorter period as I want to test an 'n' shape price curve - again with price ending up where it started.
Again - a market going nowhere.
Buy and Hold:
Initial Investment : $100,000
End Num Shares : 3703
End Value : $96,389.09
AIM
Initial Investment : $100,000
End Num Shares :3,446
End Value Shares : $89,699.38
End Value Cash : $27,817.80
End Portfolio Value : $117,517.18
The point here is to see if AIM is robust. Thus far AIM has...
- reduced the return on an market that goes straight up
- increased the return on different types of market that end up where they started.
Note that I don't intend to buy anything that ends up where it started - it's just a test.
Also note that AIM is tunable. The initial % in cash is 50% in the original version. Portfolio control adjustment is 50% of any purchases. There are some 'improvements' on AIM that came later & those MAY be tested too.
For instance, you you adjust the safe pct from 10 to 50%, the above AIM results now look like this :
Initial Investment : $100,000
End Num Shares :2,292
End Value Shares : $59,660.76
End Value Cash : $82,437.71
End Portfolio Value : $142,098.47
So - for now, I'm not going to dick around with the parameters for AIM. It can be done, it will affect results but it is a variable that needs to be tested later IMO...
Also - as expectations can affect results, I'd better tell you where I think this is heading:
1 - AIM may actually conflict with Asset Allocation strategy that also dictates when you buy/sell (on re-balancing)
2 - If spreading the risk across 5 or 6 non correlated asset classes, you probably don't need to put away 50% of the entire portfolio in the cash account at the outset. As the asset classes are not correlated, some markets should be adding to the cash account whilst another is drawing on it.
3 - obviously there are times, as we saw earlier this year, where many, if not all asset classes can be correlated.
Attachments
Last edited: