Heavenskrow
Newbie
- Messages
- 4
- Likes
- 0
Hey guys I have been a huge fan of TA ever since I started trading.
Ive been bearish since feb 22nd and becoming bearish as time passes from there.
Bearish divergence, failed inverted H+S, and BULL TRAP on June 1st
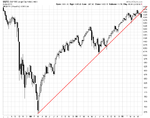
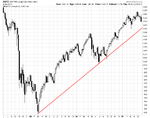
Now my question is for the trend from March low 2009 for the sp500, which charts do the "pros" use? I understand to use logarithmic for stocks like AIG, or SIRI, but i dont see the point for sp500(I mainly use linear to trade)
But I noticed on logarithmic charts, its looking very bearish for MANY indicies all breaking their HUGE supports.
Please let me know which one is best...so i can confirm my bear analysis
Logarithmic:


