Line Trading

Is this the type of S/R zone that you are talking about DB? We're in one at the moment with the EUR/ JPY... that's why it's stalling at the high of the day today around 163.80.

At least if you are aware of this then you can take action before things go against you.
 

Attachments

  • EURJPY.JPG
    EURJPY.JPG
    208.4 KB · Views: 214
A lot of people have taken old concepts and given them new names. Market Profile is another.
I've not seen any other systems compared with Steidlmayer's Market Profile in the sense of pre-dating it. Conceptually, taking 'time segment at price level' as a representational system borrows on time and price of course, but then what doesn't.

I'd be genuinely interested to hear what you consider he based his approach on. Something as revolutionary as MP would have had its detractors by the dozen at the time if they’d had the chance (it's a valid form of sport, trashing the new gods while idolising the old ones), but there weren't many then that did, or have since. And certainly none to my knowledge claiming a bare rehash.
 
Is this the type of S/R zone that you are talking about DB? We're in one at the moment with the EUR/ JPY... that's why it's stalling at the high of the day today around 163.80.

At least if you are aware of this then you can take action before things go against you.

Yes, though I wouldn't make it quite so narrow. I don't trade forex because there's no volume. However, it seems clear that demand is being tested, given the length of the base that you highlighted. Either buyers are willing to support the price here or they aren't. The task is to determine what you're going to do regardless of the outcome.

Db
 
Trading trendline breakouts

Hi

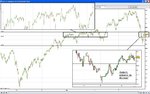
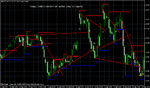
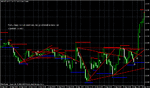
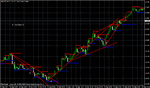
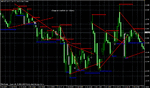
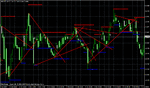
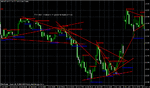
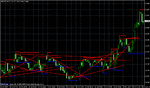
These screenshots show 10-min charts GBPUSD charts that i've been playing around with.
Basic trendline breakout entry on the open of the candle following the breakout (close above/below the trendline).

Profit taking unspecified/discretonary as of yet.

Roughly using a 20 pip SL maximum unless can think of a more effective SL method.

Arrows show open of candle that entry occurs on.

Arguable cherry picking of trade entries is a distinct possibility in these historical screenshots/simulations. As if you draw the right number of lines in the right places, you can justify any trade decision. But approx. 55 of the 74 entries could enable a profit of maybe 15-20+ pips.

Had in mind a BESL+1 pip, if price pulls back from say +15 pips to zero.

All feedback welcome.
Many thanks.


PS. The S/R (barry) indicator is on the charts posted (BLUE & RED DOTS), but is not part of any thinking behind the TL trade entries.
It draws S/R levels on the chart based on high/low of a candle.

S/R (barry)looks really good historically, but in real-time the level that is marked, only appears on the open of the 3rd bar above/below the S/R level, thus it repaints the past 2 bars and the present one. Also, if on this 3rd bar (that the 3 dots all initially appear on together) price crosses beyond the S (blue)/R(red) level, the 3 dots dissappear.
Therefore you are left with a pretty looking chart that didn't look like this in real-time, thus giving a false impression.
From my observations, roughly 1/4 of new S/R levels dissappear in this way on the first bar that they appear on. So its not as useful as it looks historically basically.
 

Attachments

  • srb1.gif
    srb1.gif
    31.1 KB · Views: 220
  • srb2.gif
    srb2.gif
    27.3 KB · Views: 198
  • srb3.gif
    srb3.gif
    25.4 KB · Views: 162
  • srb4.gif
    srb4.gif
    31.3 KB · Views: 162
  • srb5.gif
    srb5.gif
    31.3 KB · Views: 169
  • srb6.gif
    srb6.gif
    29.1 KB · Views: 191
  • srb7.gif
    srb7.gif
    25.9 KB · Views: 191
Last edited:
Top