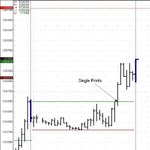
Joey's MP Journal

Status
Not open for further replies.
Sold at 1232.00
Stop at 1234.25
Target at 1228.00
Exit at 1233.00
Gross p/l = -1.00

Have now entered the order:

Sell at 1235.50
Stop at 1239.50
Target at 1231.50

If not filled by 12.45, will pull the order and wait until at least 30 minutes after the release of the FOMC minutes.

As with the POC trade this morning, the test occurred in my "sit-out" period.

I'm not interested in any historical levels until 1268.00, so unless an unlikely reversal pattern occurs in the next hour, that's me done for the day.
 
16th July End of Day

Trade 1
Sold at 1232.00
Exit at 1233.00
Gross p/l = -1.0

Total = -1.0
 
Key Numbers EPU8 for use July 17th

9th July "New Beginning" : 1268.00

Daily Pivot Point: 1229.92

Daily Point of Control: 1229.25

5-day Overlay Point of Control: 1228.50
 
Thoughts going into the open

Phily Fed out at 9.00am.

My main trade is a "New Beginning" level from the 9th July:

Sell at 1267.75
Stop at 1270.75
Target at 1263.75

Bullish Single Prints in the overnight session correspond to the upside breakout of a trendline on the daily bar chart.
 

Attachments

  • Single Prints.JPG
    Single Prints.JPG
    61.8 KB · Views: 164
Modified Order

Sell at 1261.75
Stop at 1264.75
Target at 1257.75

Top of an intra-day spike bar.
 
Sell at 1261.75
Stop at 1264.75
Target at 1257.75

Top of an intra-day spike bar.

The market got as high as 1261.00 before sharply falling. If I'm not in a position at 15.00pm I finish for the day.
 
Key Numbers EPU8 for use July 18th

New Beginning 9th July: 1268.00

Top of Spike 17th July: 1262.00

Daily Point of Control: 1252.25

Daily Pivot Point: 1251.50

5-day Overlay Point of Control: 1228.50
 
Thoughts for Today

As does tend to happy quite a lot, some of the levels have been tested either in the overnight session or the opening 30-minutes of RTH. (I like the first 30-minute range to form before entering trades).

Some ideas for today:

1) Sell at 1267.50
Stop at 1270.25
Target at 1264.25

This is a New Beginning area from the 9th July.

2) Sell at 1272.75
Stop at 1275.50
Target at 1269.50

This is the Point of Control, very well-defined, also from the 9th July.

I'm still trying to strike the right balance, when it comes to trading tactics, between entering too far ahead of the levels (like last week) or too close (this week).
 
18th July End of Week

Total for week = +2.75 -1.00 = +1.75

Feeling pretty down as I missed a couple of trades by tightening the entries this week. Just goes to show though that with the most "potent" levels you could probably get away with the tightest of tight stops.

Also, as I'm using a short-only strategy, partly to get in the queue as quick as possible, this week has seen the price generally trading above the key pivots.

Waiting for the first 30-minute range to form definitely adds to the effectiveness of those levels not tested in that time. For example, today the Daily Pivot Point only got tested in the second half hour and ended up being the exact low of the RTH session.

Thoughts for next week

(1) Slightly more aggressive entries next week.
(2) Pleased with POC, weekly POC and PP.
(3) Single print method in conjunction with subsequent half hour rule is an improvement on the way I used it in the first week.
(4) Keep a record of the last 5 Daily POCs and note the untested ones, but no further back in time.
(5) Keep to the relatively small list of "potent" historical resistance levels. These can go back as far as rollover day (e.g 1268.00 and 1300.50).

Finally, I've been testing the patterns casually against the Bund, so maybe I should do that a bit more formally.
 
Point of Control Week Ending 18th July

The Point of Control moved as follows throughout the week:

14th July: 1229.75
15th July: 1216.00
16th July: 1229.25
17th July: 1251.50
18th July: 1256.75

A test to the downside on Tuesday, with an upward movement of value above the 1229.00 region, finishing the week building value around 1256.00.

The 5-day Overlay Point of Control is 1228.50.

However, the chart of the overlay shows that 2 seperate distributions formed last week, with the second around the 1256.00 level.
 

Attachments

  • 5-day merge.JPG
    5-day merge.JPG
    31.1 KB · Views: 131
Key Numbers EPU8 for use July 21st

Anticipated Resistance Levels:
1300.50
1290.75
1285.75
1280.00
1268.00
1265.25

Daily Point of Control: 1256.75

Daily Pivot Point: 1254.83

5-day Overlay Point of Control: 1228.50
 
Thoughts for today + Money Management

The Overnight Low of 1256.00 indicates a strong bounce off the Daily Point of Control.

There was a failed auction spike through the 1268.00 level, but this has been tested in the first 30 minutes.

My first order entry is likely to be:

Sell at 1279.50
Stop at 1282.50
Target at 1275.50

Money Management

I think it's a good idea to have an idea of when you'll stop for the day if things go badly.

I aim to have a Daily Loss Limit equal to:

Daily Loss Limit = Partial Loss + Full Loss

Now, if the Full Loss occurs on the first trade that will be it for the day, since opening another trade exposes the account to more than the Daily Limit. Likewise, a profit on a trade creates extra capacity for the rest of the day.
 
End of Day July 21st

I did the following Single Print trade which was a Full Loss:

Sell at 1259.50
Stop at 1262.50
Target at 1255.50
Gross p/l = -3.0

Disappointing, overwhelmed by buyers coming in at the bulge of the top distribution in the merge chart posted this morning.
 
I did the following Single Print trade which was a Full Loss:

Sell at 1259.50
Stop at 1262.50
Target at 1255.50
Gross p/l = -3.0

Disappointing, overwhelmed by buyers coming in at the bulge of the top distribution in the merge chart posted this morning.

I dont understand the loss. From about 3pm onwards, the SPX was falling, so the short was a good one, albeit a bit late.
what time did you trigger the trade?

Good stuff by the way, although I think giving yourself 30 pips for fudge, and only gunning for 1:1 r:r is just nibbling at the SPX
Is this your main strategy, or do you trade other markets simultaneously?
Are 3 SPX points (30 pips) enough?

Cheers, Trendie. The rr is now 3 for 4, but I know what you mean. You're not the first person to comment on this (see pm)

My income is from options trading FTSE and not this (thank God).

The idea with this is to forward test some strategies over say 30 trades, review and then go more aggressive with the trade management. For example, I didn't anticipate the overnight session being so volatile and "using up" a lot of my strategies.
 
Gathering Results by Trade Type

Since starting this journal certain trade types, if they succeed, produce good moves, whereas others quite often produce minor moves.

I'm very grateful for the advice from traders so far who have raised the question of whether my winners are big enough. Therefore, I'm going to stick to the trades which, if they win, win big. This should enable a more "expansive" style as I gather confidence.

From now on the trade types will be categorized as follows:

Historical
1) Historical Type A 2) Historical Type B (Type B shows itself on the split profile only)
3) Daily Pivot Point 4) Daily Point of Control 5) Weekly Point of Control

Intraday
1) Intraday Type A 2) Intraday Type B (Type B shows itself on the split profile only.

No trading before 9.05am Chicgao time, initially risking 3 points to get 4. Review after 30 trades, with the possibilty of then increasing the targets.

Also, I must tell myself that there is no shame in not trading in a session. If the end result of this journal is that I take 3 trades a week aiming for very large targets, then so be it.
 
Last edited:
Keu Numbers EPU8 for use July 22nd

Anticipated Resistance Levels (Historical Types A & B since Rollover Day)
1351.75
1343.25
1328.75
1316.75
1308.00
1300.50
1290.75
1280.00

Daily Point of Control: 1262.00

Daily Pivot Point: 1261.83

5-day Overlay Point of Control: 1256.75
 
1st Order

The first order entry for today is:

Sell limit at 1261.50
Stop at 1264.50
Target at 1257.50

This is both the Daily Pivot Point and the Daily Point of Control.
 
July 22nd Trade 1

Sold at 1261.50
Stop at 1264.50
Target at 1257.50
Exit at 1262.50
Gross p/l = -1.00

Since it's a partial loss only, have entered the following order:

Sell limit at 1279.50
Stop at 1282.50
Target at 1275.50

This is a historical level from the 2nd July
 
End of Day 22nd July

Trade 1: Trade Type: Daily Point of Control
Sold at 1261.50
Stop at 1264.50
Exit at 1262.50
Gross p/l = -1.00

Total = -1.00

This type of trade, even though a loss, was more manageable than the trade yesterday because price has a tendency to slow into a high volume area.

I've put the Overlay on the backburner for the moment as it's not adding much more value (for me anyway) beyond the daily levels, the historical levels and the intraday levels I'm already using.

Felt quite calm today and looking forward to gradually expanding the targets over the next few months.
 
Status
Not open for further replies.
Top