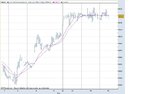
I've been trading for years like this. My charts are on various threads on this site. Sometimes they have different timeframes to others but they all come down to the same thing. I'm a trend follower who uses averages and pullbacks. There is not very much to teach, so I just show a chart. Some days are better than others, just as you can see that this week has been flat. That's trading for you. I think that the trouble is that lots of guys change to something else as soon as they get stopped. You have to give your method a chance.
You are using an out of date browser. It may not display this or other websites correctly.
You should upgrade or use an alternative browser.
You should upgrade or use an alternative browser.
Is it true, you can trade without indicators and candlesticks?
DionysusToast
Legendary member
- Messages
- 5,965
- Likes
- 1,501
"Its time to play the music its time to get things right......on the muppet show tonight"......
Definitely getting like the muppet show on this thread,, claiming that you don't use candles / indicators then going on to confirm that you do......claiming that its the long term company picture thats important when your recent posts have been scalping 20-30 cents on day trades....
I appreciate that you are having a hard time keeping up.
I do swing trade and I also day trade.
Is this too complicated or would you like it in crayon ?
In your post above you again confirm that you are using a candlestick pattern to trade albeit from the opposite side....but the point is that you are looking at a visual representation of price in the form of a chart / candles / bars
Now - you are just being silly. You know full well what candlestick trading is. Do you want to talk semantics or trading ?
The main point of the OPs original query is whether you can trade without any bars / candles ie just tape read, rather than whether trading on the basis of complicated / inpractical candle patterns is effective which is the query you responded to (and seems to be the theme to your life).
And the answer is no - candlesticks are for suckers.
.....and of course there are pure tape readers out there who dont look at charts, but most effective traders would use candles / bars / charts, and mostly in a fairly basic effective methodology as noted by Shakeone......
Semantics again, we all know full well what candlestick analysis is in the domain of trading.
Next you'll be saying I use indicators because I drive a car... 🙄
dick_dastardly
Established member
- Messages
- 843
- Likes
- 152
Next you'll be saying I use indicators because I drive a car... 🙄
Many people that drive a car don't use their indicators 😡
dd
arabianights
Legendary member
- Messages
- 6,721
- Likes
- 1,380
You should only use your indicators when they would be of benefit to other road users... use them all the time and you will fail your advanced driving test...
timsk
Legendary member
- Messages
- 8,912
- Likes
- 3,629
Hmmn, not sure about this Arabian!You should only use your indicators when they would be of benefit to other road users... use them all the time and you will fail your advanced driving test...
I'm not an advanced driver or, even, an especially good one (by my own standards). However, I am safe and if I indicate to the fairies and the ghosts - as opposed to other mortal road users - am I doing any harm? Am I driving badly or endangering my life or anyone else's? I would think not. However, if I get out of the habit of using my indicators - even when I don't need to, then I run the risk of not using them when they're really needed. And the consequences of that could be fatal.
When I traded U.S. stocks every day, I made a point of checking for news announcements every day - especially those due out at 10.00am (3.00pm U.K. time). 9 times out of ten they amounted to nothing in terms of their effect on the prices of the instruments I was watching. Following a break from trading, I got out of the habit of doing this. When I resumed trading earlier this year, I forgot to check for news releases one day and entered a trade around 9.58 am - with inevitable consequences. I had a stop in place which my platform automatically puts in on every trade - so the damage was minimal. But the loss was entirely avoidable. Stupid, stupid mistake. Now I check for news as part of my routine - whether I need to or not. As I say, I'm not an advanced driver. I'm certainly not an advanced trader either, and I'm happy to live with both!
😉
Tim.
arabianights
Legendary member
- Messages
- 6,721
- Likes
- 1,380
Tis all dogma tim, obviously there's no harm in indicating unnecessarily, so long as it ain't confusing - the thinking is that it's better to make ya think...
Prawnsandwich
Well-known member
- Messages
- 339
- Likes
- 30
I appreciate that you are having a hard time keeping up.
I do swing trade and I also day trade.
Is this too complicated or would you like it in crayon ?
Now - you are just being silly. You know full well what candlestick trading is. Do you want to talk semantics or trading ?
And the answer is no - candlesticks are for suckers.
Semantics again, we all know full well what candlestick analysis is in the domain of trading.
Next you'll be saying I use indicators because I drive a car... 🙄
Listen, you've got your arrse thoughoughly kicked on this issue on a number of threads, anyone can do a search, yet you keep coming back to this boring, childish and simplistic TA doesnt work, indicators dont work, candlesticks dont work and other stoopid statements...
Frankly I just get sick of seeing your bullsh1t constantly posted on the forum, to the farking point of saturation, when there are other posters when have real value and experience to contribute to either newbies or experienced traders....
why don't you just let it go ...relax....you don't need to continually take a negative / skewed view of TA just because you have clearly failed to use it in any effective manner..maybe even learn from those who use it very effectively.....open your mind ffs....you dont have to stick to the same constant dogma.....
"Candlesticks are for suckers" is one of the most idiotic statements I have heard on T2W and that takes some .......
Traders who use candlesticks are not necessarily talking about some farking flock of seagulls alligned with the clouds type of pattern - they are merely a representation of price and underlying crowd behaviour ....eg long white candles followed by narrow range retracement bars indicating a big move followed by orderly consolidation before the next move up......
FFS if you are daytrading and not taking account of the above basic type of pattern then you are pissing against the wind..scalping 20-30 cents and patting yourself on the back..but whats worse is that you are constantly coming on here dishing out advice and exposing your own ignorance.....
Prawnsandwich
Well-known member
- Messages
- 339
- Likes
- 30
Listen, you've got your arrse thoughoughly kicked on this issue on a number of threads, anyone can do a search, yet you keep coming back to this boring, childish and simplistic TA doesnt work, indicators dont work, candlesticks dont work and other stoopid statements...
Frankly I just get sick of seeing your bullsh1t constantly posted on the forum, to the farking point of saturation, when there are other posters when have real value and experience to contribute to either newbies or experienced traders....
why don't you just let it go ...relax....you don't need to continually take a negative / skewed view of TA just because you have clearly failed to use it in any effective manner..maybe even learn from those who use it very effectively.....open your mind ffs....you dont have to stick to the same constant dogma.....
"Candlesticks are for suckers" is one of the most idiotic statements I have heard on T2W and that takes some .......
Traders who use candlesticks are not necessarily talking about some farking flock of seagulls alligned with the clouds type of pattern - they are merely a representation of price and underlying crowd behaviour ....eg long white candles followed by narrow range retracement bars indicating a big move followed by orderly consolidation before the next move up......
FFS if you are daytrading and not taking account of the above basic type of pattern then you are pissing against the wind..scalping 20-30 cents and patting yourself on the back..but whats worse is that you are constantly coming on here dishing out advice and exposing your own ignorance.....
By the way I'd post you a simple chart showing you how to daytrade, but I'd prefer to leave you wallow in your own self-agrandised ignorance....
DionysusToast
Legendary member
- Messages
- 5,965
- Likes
- 1,501
Listen, you've got your arrse thoughoughly kicked on this issue on a number of threads, anyone can do a search, yet you keep coming back to this boring, childish and simplistic TA doesnt work, indicators dont work, candlesticks dont work and other stoopid statements...
Frankly I just get sick of seeing your bullsh1t constantly posted on the forum, to the farking point of saturation, when there are other posters when have real value and experience to contribute to either newbies or experienced traders....
why don't you just let it go ...relax....you don't need to continually take a negative / skewed view of TA just because you have clearly failed to use it in any effective manner..maybe even learn from those who use it very effectively.....open your mind ffs....you dont have to stick to the same constant dogma.....
"Candlesticks are for suckers" is one of the most idiotic statements I have heard on T2W and that takes some .......
Traders who use candlesticks are not necessarily talking about some farking flock of seagulls alligned with the clouds type of pattern - they are merely a representation of price and underlying crowd behaviour ....eg long white candles followed by narrow range retracement bars indicating a big move followed by orderly consolidation before the next move up......
FFS if you are daytrading and not taking account of the above basic type of pattern then you are pissing against the wind..scalping 20-30 cents and patting yourself on the back..but whats worse is that you are constantly coming on here dishing out advice and exposing your own ignorance.....
That's a heartwarming post PS. I especially liked the part how you'd teach me how to trade but.....
Using something that is right just as often as it is wrong does not interest me. DT didn't fail at textbook TA, textbook TA failed at DT.
I will give you the opportunity to prove your point. Lay down 1 specific candlestick pattern, explain to us all why you think it works (and none of this "it just does nonsense") as well as how often the pattern is succesful and how often it fails. This should be fairly easy if you believe in them.
In return, I will spend the time to data mine your theories on the market(s) of your choice and present the results here. We will see if your pattern bears fruit.
In the meantime, I will re-iterate. Candlesticks in long term trading of equities mean very little because there are so many other things that will drive the price. All markets have different elements that drive the price. In equities, there is finite supply (i.e. float) which is unlike the futures markets. No candlestick proponent can explain why textbook TA can be used on an infinite supply and a finitie supply market in the same way other than "it just works". Perhaps you will be the first to explain why supply is irrelevant when using candlesticks.
In the short term, it is buying & selling pressure that drives the price. Nothing else will tip the markets hand as well as T&S and the DOM. If price action occurs one minute, it will make a certain candle pattern, if it occurs a minute later a different pattern will form. You may see a hammer or you may see an engulfing pattern when price appears to be bottoming out, the only difference will be what timeframe you are using. Alternatively - you may see things on the DOM/T&S at this point to lead you to the conclusion that this reversal is not real and people are being suckered into thinking it's a reversal. There is nothing in candlesticks that gives you this quality of information.
Anyway - if you put forward your theory on any candlestick pattern, I'll put my coding skills into practise and we'll come up with some real failure rates.
Last edited:
timsk
Legendary member
- Messages
- 8,912
- Likes
- 3,629
Hi DT & PS,
Discretion is the better part of valour they say and I ought to know better than to stick my nose into other people's arguments. Experience tells me that there's a good chance that it'll get bloodied. However . . .
I think you both have valid and invalid points.
I suspect that the challenge DT has laid down - if accepted - will produce results of XYZ pattern working around 40% of the time. Or, for the anti-candlestick lobby - the pattern fails 60% of the time. To my mind, this doesn't settle the argument. Even if the figures were as low as 30% works / 70% doesn't work - it still wouldn't be especially significant to me. Why? Because statistical studies of this kind using large(ish) amounts of data can't use discretion. A good discretionary trader will put XYZ pattern in context. Context is king and is the difference between a pattern working or failing, IMO. In theory (although I accept not very likely in practice), the discretionary trader could trade XYZ pattern on just the occasions that it works - to produce a 100% success rate, even though statistically it only works - say 30% of the time. For this reason, any study that doesn't take account of discretion doesn't 'prove' anything to me. Therefore, I suspect that the argument about TA and candlestick patterns will rumble on for a long time to come, without either side ever being able to provide conclusive evidence to support their views.
Anyway, as you were gentlemen!
😉
Tim.
DionysusToast
Legendary member
- Messages
- 5,965
- Likes
- 1,501
Tim - that's not a bad description of why textbook TA doesn't work in isolation.
Anyway - if candlesticks did only work 30% of the time, they'd be worse than a coin toss - I can't see how adding discretion to something that fails most of the time is a good idea.
Why not add it to something more reliable ?
Anyway - if candlesticks did only work 30% of the time, they'd be worse than a coin toss - I can't see how adding discretion to something that fails most of the time is a good idea.
Why not add it to something more reliable ?
timsk
Legendary member
- Messages
- 8,912
- Likes
- 3,629
Hi DT,
If said discretion can filter out the 70% of failures then it's an excellent idea. If it can't filter out any failures at all or, worse still, somehow increases their numbers - then it's a very bad idea. It compounds the problem, rather than helping to aleviate it.
You've suggested reading the tape and DoM ladder - and I take my hat off to you if these work for you. I would argue that these 'tools' are, broadly speaking, discretionary ones. If they're used in conjunction with TA / candlestick analysis by an experienced and knowledgable trader, they should help to produce a profitable strategy. Indeed, they might be the very tools used to help filter out the 70% of losing TA patterns!
Tim.
It might not be. It might be a lousy idea - it all depends upon the discretion!Anyway - if candlesticks did only work 30% of the time, they'd be worse than a coin toss - I can't see how adding discretion to something that fails most of the time is a good idea.
If said discretion can filter out the 70% of failures then it's an excellent idea. If it can't filter out any failures at all or, worse still, somehow increases their numbers - then it's a very bad idea. It compounds the problem, rather than helping to aleviate it.
Great!Why not add it to something more reliable ?
You've suggested reading the tape and DoM ladder - and I take my hat off to you if these work for you. I would argue that these 'tools' are, broadly speaking, discretionary ones. If they're used in conjunction with TA / candlestick analysis by an experienced and knowledgable trader, they should help to produce a profitable strategy. Indeed, they might be the very tools used to help filter out the 70% of losing TA patterns!
Tim.
DionysusToast
Legendary member
- Messages
- 5,965
- Likes
- 1,501
Finding something that fails most of the time & then attempting to filter out the failures sure does seem a long-winded way about looking for something that works dontchathink ?
I think the word 'discretionary' covers a whole multitude of sins - in fact, it seems we are saying that everything that isn't TA is discretionary trading....
I think the word 'discretionary' covers a whole multitude of sins - in fact, it seems we are saying that everything that isn't TA is discretionary trading....
spy74
Active member
- Messages
- 118
- Likes
- 12
Any decent TA book (I'm thinking of Murphy...) will say that no one technical pattern/indicator should be used in isolation. in fact, from what i've read, confirmation with other TA indicators/patterns is one of the basic ideas of TA itself. Most say that good TA begins with a basic understanding of determining trend from observing price action (HH,HL,LH,LL etc etc), especially the trend of timeframes higher than the one from which you take your entries/exits off.
From there, you add other forms of TA, such as S&R, Fibs, Pivots, Oscillators etc etc to build a strategy which, when combining a few of these "indicators" together, ends up providing the components of a set-up which should have higher probability of success than if you used any one of them in isolation.
Even Nison et al say that candlesticks are simply another ingredient to add to a trading strategy mix - they're good for helping determine bullish, bearish, indecisive price behaviour, but no use at all for indicating how far prices will reverse/continue.
People tend to want to look for a set rule - ie, "always sell divergence of RSI with price", so they don't have to think and interpret the current market, when i think that even the guy that invented RSI would never use it in isolation like that.
If you are looking at RSI divergence, combined with (say) a pivot, and some bearish candlesticks, in the direction of a higher time-frame trend - that could be a good high prob set-up, where as selling RSI divergence alone in the face of a raging price action trend has a very high likelihood of failing (take it from someone who knows!)
DionysusToast
Legendary member
- Messages
- 5,965
- Likes
- 1,501
I think it's enough to lead someone away, Tim.
DionysusToast
Legendary member
- Messages
- 5,965
- Likes
- 1,501
Any decent TA book (I'm thinking of Murphy...) will say that no one technical pattern/indicator should be used in isolation. in fact, from what i've read, confirmation with other TA indicators/patterns is one of the basic ideas of TA itself. Most say that good TA begins with a basic understanding of determining trend from observing price action (HH,HL,LH,LL etc etc), especially the trend of timeframes higher than the one from which you take your entries/exits off.
From there, you add other forms of TA, such as S&R, Fibs, Pivots, Oscillators etc etc to build a strategy which, when combining a few of these "indicators" together, ends up providing the components of a set-up which should have higher probability of success than if you used any one of them in isolation.
Even Nison et al say that candlesticks are simply another ingredient to add to a trading strategy mix - they're good for helping determine bullish, bearish, indecisive price behaviour, but no use at all for indicating how far prices will reverse/continue.
People tend to want to look for a set rule - ie, "always sell divergence of RSI with price", so they don't have to think and interpret the current market, when i think that even the guy that invented RSI would never use it in isolation like that.
If you are looking at RSI divergence, combined with (say) a pivot, and some bearish candlesticks, in the direction of a higher time-frame trend - that could be a good high prob set-up, where as selling RSI divergence alone in the face of a raging price action trend has a very high likelihood of failing (take it from someone who knows!)
Spy - let's say candlestick formations work 30% of the time and RSI makes money 30% of the time. Surely the combination of the 2 would see you making money 10% of the time. Combining 2 things that work poorly on their own isn't going to give you something that works well.
I'll tell you what though - let's expand the offer I made earlier. If someone can give a combination of TA indicators, I will code it up and data mine across multiple markets to show how well they work (or not) in unison.
As for Nison - he's not a trader, he makes his money from his teaching businesses, books, articles, TV appearances etc. He's a bit of a celeb.
Why is his opinion on what would make money trading so highly valued?
spy74
Active member
- Messages
- 118
- Likes
- 12
Spy - let's say candlestick formations work 30% of the time and RSI makes money 30% of the time. Surely the combination of the 2 would see you making money 10% of the time. Combining 2 things that work poorly on their own isn't going to give you something that works well.
I'll tell you what though - let's expand the offer I made earlier. If someone can give a combination of TA indicators, I will code it up and data mine across multiple markets to show how well they work (or not) in unison.
As for Nison - he's not a trader, he makes his money from his teaching businesses, books, articles, TV appearances etc. He's a bit of a celeb.
Why is his opinion on what would make money trading so highly valued?
i will decline your kind offer
i've done enough sim trading and testing on my own, with acceptable results, to satisfy myself that my approach (using some simple TA) works well enough to trade it live, hence why i bothered writing the post above.
I don't know Mr Nison, and I don't care how he makes his money. One of his books has taught me some things which have helped me interpret price action, i've incorporated a portion of it into my trading, and i'm (so far) making money off it.
that's all that counts to me 🙂
Similar threads
- Replies
- 1
- Views
- 4K
- Replies
- 2
- Views
- 2K