I stopped using indicators 2 years ago. Built an AI that does what professionals actually do. Here's what I learned.

macrowish

Newbie
Messages
3
Likes
0
Let me start with something that's going to annoy a lot of people on this forum.
The reason most retail traders lose isn't their entries. It's not their stop placement. It's not even their psychology.
It's that they're using tools designed to react to price, to try to predict price.

RSI. MACD. Stochastics. Moving averages. Bollinger Bands. All of these measure what already happened. They are rearview mirrors dressed up as windshields.

I know I used all of them for years.
Two years ago I went deep on how professional macro traders at the institutional level actually make decisions. Not YouTube traders. Not influencers with 400k followers selling a course. I mean people who ran books at banks and hedge funds.
What I found was embarrassingly simple and completely different from everything I'd been taught.

Professionals don't start with a chart. They start with a question:

What is currently priced into this asset and what would surprise the market?
That's it. That's the entire edge. Find the gap between what the market expects and what's actually developing in the macro data. Get in before the repricing. Manage risk. Repeat.
They use something I now call the 80/20 rule 80% of the work is fundamental analysis identifying the idea. Only 20% is technical, and that's just for timing the entry. Technicals never generate the idea. Ever.
Here's an example of how this thinking works in practice.
Most traders look at EUR/USD, see it dropping, and short it because it's in a downtrend. That's reactive. You're following price.
A professional asks: what's driving this? Is European growth decelerating relative to the US? Is the ECB behind the Fed in the rate cycle? Is that divergence early and widening or late and crowded?
Early + widening divergence = high probability trade.Late + narrowing = the trade is crowded. You're the last one in.
One of those setups has 3:1+ R:R with macro tailwinds. The other gets you chopped out because everyone else already positioned six months ago and they're now taking profit into your face.
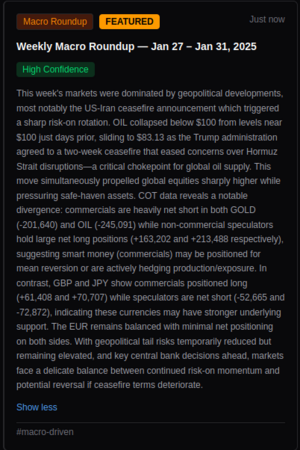
After I understood this, I had a problem: doing rigorous macro analysis properly takes hours per asset. You need to track GDP rate of change, CPI trends, employment data, central bank policy divergence, COT positioning, implied volatility ranges and then synthesize it all into a clear trade decision.
Most people don't have time for that. Including me.
So I built something.
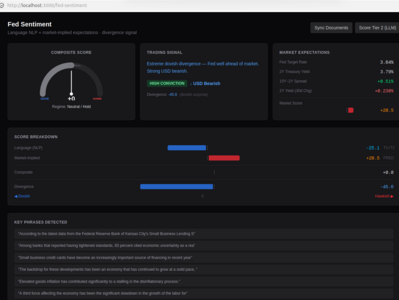
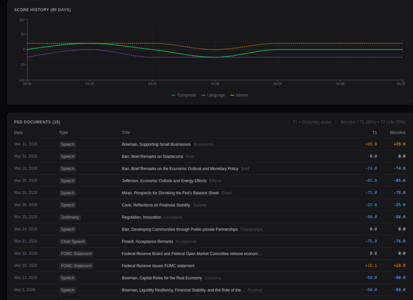
I spent the last two years building an AI-powered trading engine that runs this entire analysis automatically. It pulls live macro data, classifies the market regime, maps the Growth/Inflation quadrant, runs a 3-step fundamental analysis, gates the entry with technical and volatility levels, and spits out a graded trade signal A, B, C, or Pass with full entry, stop, and target parameters.
It doesn't predict the market. It does what a professional trader does at the start of every trading day. Systematically. In about 30 seconds.
I'm going to be posting here regularly sharing the signals it generates in real time, the reasoning behind each trade, and eventually opening early access to the tool itself.
No paid course. No Discord. No indicators to buy.
Just the system, the signals, and the results posted publicly so you can verify everything.


First live signal post goes up this week.


If you want to understand the methodology before then, ask me anything below. I'll answer every question in detail.
I attached a video So you can see yourself how fast with AI we can analyze the markets.
looking forward to talk to you guys soon and learn from the rest of you.

Regads
Macro Wish
2026-04-02_08-02-54.png
2026-04-02_08-17-06.png
2026-04-03_21-26-14.png

 
Every Six Weeks, Twelve People Move Trillions of Dollars With a Press Release. We Built an AI to Decode It.


On June 15th, 2022, Jerome Powell walked up to a podium and did something the Federal Reserve hadn't done in 28 years: he announced a 75 basis point rate hike. Markets went haywire. The dollar spiked. Equities cratered. Traders who were positioned for the consensus expectation of 50 basis points got destroyed.


But here's the thing the signs were there. For weeks before that meeting, the Fed's language had been escalating. The word "transitory" had long been abandoned. Phrases like "expeditiously" and "ongoing increases" were creeping into every speech. The tone was getting louder. Hotter. More urgent.


The market wasn't listening carefully enough.


Two years later, September 2024. The Fed cuts by 50 basis points the first cut in four years. A massive policy shift. And the dollar barely moved. Why? Because this time, the market had been listening. Futures had priced it in weeks earlier. By the time Powell said the words, they were already old news.


Same Fed. Same magnitude of move. Completely opposite market reactions. The difference wasn't the decision itself it was whether the market saw it coming.


That difference is what we've spent the last several months obsessing over. And we think we've found a way to systematically capture it.


The Trillion-Dollar Blindspot​


Here's what most people get wrong about Fed analysis: they focus on what the Fed says. Hawks or doves. Hike or cut. Tough on inflation or worried about growth.


That's only half the equation.


The other half, the half that actually determines whether a trade makes money, is what the market already believes. Because if the Fed comes out hawkish and the market has been pricing hawkish for three weeks, there's nothing left to trade. The move already happened.


The real opportunity lives in the gap between the two. When the Fed says one thing and the market is priced for something different, that's a divergence. And divergences, historically, produce the largest and most tradeable moves in currencies, bonds, and equities.


This isn't a theory. Look at the data.


January 2019. The Fed removes "further gradual increases" from its statement ,three words disappear and it signals the end of the entire tightening cycle. The market hadn't priced a pivot. DXY dropped like a stone.


November 2021. Powell stops calling inflation "transitory" after months of using the word. The market was still positioned for a patient Fed. What followed was the most aggressive tightening cycle in four decades.


January 2023. Powell says "disinflation" thirteen times in a single press conference. Thirteen. Markets had been expecting continued hawkishness. The pivot signal was deafening, and the dollar sold off hard.


Every single one of these was a divergence event ,the Fed's language shifted in a direction the market hadn't fully priced. Every single one produced an outsized move. And every single one was, in hindsight, detectable before the market repriced.


The problem is that detecting these divergences has always required two things at the same time: understanding what the Fed is actually saying (which requires deep analysis of nuanced language) and understanding what the market already expects (which requires parsing futures curves, yield spreads, and probability surfaces). Very few humans can do both simultaneously at speed. No widely available tool even attempts it.


Until now.


What We Built​


We built a module part of a larger AI trading system we've been developing that does both sides of this analysis in real-time and produces a single, actionable output.


One side reads the Fed. Every statement, every set of minutes, every press conference transcript, every speech by every FOMC member, the Beige Book, congressional testimony. All of it gets ingested and scored the moment it's published. Not just "hawkish or dovish" the system tracks how much the tone has shifted compared to the last communication, which specific phrases changed, and where in the policy cycle the language positions the Fed.


The other side reads the market. Fed Funds futures, Treasury yields, the shape of the yield curve, rate swap markets. All the instruments where real money is expressing a view on where rates are headed. This gets distilled into a parallel score representing what the market currently expects.


Then the system compares the two.


When they agree, it tells us the Fed's stance is priced in trade something else. When they disagree, it tells us which direction the repricing is likely to go, and how confident we should be in that signal.


I'll be posting screenshots of the system in action over the coming weeks so you can see exactly what this looks like. But the results against historical data have been let's just say we're very encouraged.


Why This Is Hard (And Why Most Approaches Fail)​


Reading the Fed sounds easy. It's not.


The Fed doesn't say "we're going to raise rates next meeting." They say "the Committee anticipates that ongoing increases in the target range will be appropriate." Then, one meeting later, they change it to "the Committee will take into account the cumulative tightening of monetary policy." That shift from "ongoing increases" to acknowledging what they've already done is a signal that the tightening cycle is nearing its end. But it doesn't contain the word "pause" or "stop" or "cut" anywhere.


Traditional sentiment analysis counting positive and negative words using off-the-shelf dictionaries — misses this entirely. The Loughran-McDonald financial sentiment dictionary, the standard in academic finance, wasn't designed for monetary policy language. It'll tell you a sentence is "negative" when the Fed says "inflation remains elevated," but it won't tell you whether that's more or less hawkish than what they said six weeks ago. The delta is what matters, and simple word-counting can't capture it.


More sophisticated approaches exist. Georgia Tech's FinTech Lab published a landmark paper in 2023 called "Trillion Dollar Words" where they annotated 40,000 sentences from FOMC communications and trained a RoBERTa model to classify them as hawkish, dovish, or neutral. Morgan Stanley built a proprietary index called MNLPFEDS that institutional desks use. The Federal Reserve itself published a 2025 working paper on gauging FOMC sentiment.


These are all valuable. But they all solve only the language side. None of them systematically compare language sentiment against market positioning to identify the divergence. That's the piece that turns analysis into alpha.


The Fed Speaks in Code. We're Learning to Read It.​


One of the most fascinating things we discovered building this system is how precise the Fed's language actually is. Every word in an FOMC statement is debated and chosen deliberately. The shifts between meetings are measured in individual phrases, not paragraphs.


Here are some real historical examples of phrase-level transitions that preceded major market moves:


"Transitory" → "persistent" (on inflation). When this shift happened in late 2021, it told you the Fed was about to get aggressive. The word "transitory" had been their security blanket for months. Dropping it was like a pilot telling passengers the turbulence is no longer "minor."


"Patient" → "data dependent." In a tightening cycle, "patient" means "we're in no rush to raise." "Data dependent" means "we're watching every number and we'll move when we see it." It's the difference between sitting in a chair and sitting on the edge of a chair.


"Further tightening" → "well positioned." This one signals peak rates. When the Fed stops talking about tightening further and starts talking about where they already are, they're telling you the hiking cycle is over. Markets that are still pricing hikes at that point are mispriced.


"Some participants" → "several participants" → "most participants." The Fed uses these quantifiers deliberately in the minutes. Tracking the migration of a view from "some" to "most" tells you the internal consensus is shifting, often one or two meetings before the policy actually changes.


Our system tracks all of these transitions automatically. When a known pivot phrase appears or disappears it triggers a high-priority alert. Because by the time the decision is announced, the language has usually been signaling it for weeks.


The Market Side: Follow the Money​


The language analysis is one pillar. The other is understanding what the market already expects, because that determines how much of the move is already in the price.


This is where instruments like Fed Funds futures, the 2-year Treasury yield, and overnight index swap curves come in. These aren't opinion polls. They're markets where billions of dollars in real capital express a collective view on where rates are headed.


When the CME FedWatch tool shows a 90% probability of a rate cut at the next meeting, that means futures traders who have actual money on the line have already priced a cut into their positions. If the Fed then delivers that cut, the impact on the dollar is minimal. The news was already in the price.


But when FedWatch shows 30% probability of a cut and the Fed's language is screaming dovish, you've got a divergence. The market hasn't caught up yet. That's your window.


We track this continuously not just the headline probability for the next meeting, but the full curve of expectations across the next twelve months. The shape of that curve tells you whether the market expects a gradual path or a sharp turn. And when that shape conflicts with what the Fed is signaling, the system flags it.


What's Coming Next​


We're currently running this against a decade of historical FOMC events roughly 80 meetings, including every major surprise, pivot, and non-event from 2015 through 2025. The Powell "auto-pilot" disaster of December 2018. The COVID emergency cuts. The inflation shock of 2022. The first cuts of 2024.


I'll be sharing screenshots of the system's real output in upcoming posts — the scoring dashboard, the divergence signals, how it would have performed on historical events that every macro trader remembers. I want you to see it, not just read about it.


The goal isn't to predict what the Fed will do. Plenty of people try that and most of them are wrong half the time. The goal is to know when the market's prediction is wrong and to be positioned for the repricing when it happens.


If you trade FX, rates, or macro this is the problem. We think we're close to solving it.


More soon.
 

Attachments

  • fed-sentiment.png
    fed-sentiment.png
    128.6 KB · Views: 0
  • fed-sentiment1.png
    fed-sentiment1.png
    155.8 KB · Views: 0
Back
Top