traders! This week, my Lesson will show how to use multiple time frames to
trade the Forex market. In the grand scheme of this core strategy, we recommend
using three time frames to help make your investing and trading decisions,
whether you are trading stocks, Forex, Options or futures. The first time
frame, or largest time frame, is to determine where we are in the ‘big
picture’, essentially showing us where the biggest institutions are trading.
The next time frame down shows us the direction/trend between these
institutional levels. And the third or smallest time frame show us smaller
supply and demand zones so we can join the trend in between those the larger
time frame levels. Pretty easy, huh? Let’s get into a bit more detail…
Now, the
difference between these levels for multiple time frame analysis is usually a
factor of 4, 5 or 6 depending on circumstance. What this means is that if you
are using a monthly Forex chart for your largest time frame, divide the monthly
by 4, 5 or 6 to find your next lower time frame. Obviously, a weekly goes into
the monthly 4 times, so there is the next logical time frame down. A daily
chart would then go into a weekly chart 5 or 6 times, depending on the market
you are looking at (24 hour markets that start on Sunday would be 6, but stock
traders would still use daily as there are 5 trading days in the week.)
For the
following example Forex trade, I am using the EURJPY Daily, 240 minute, and 60
minute charts.
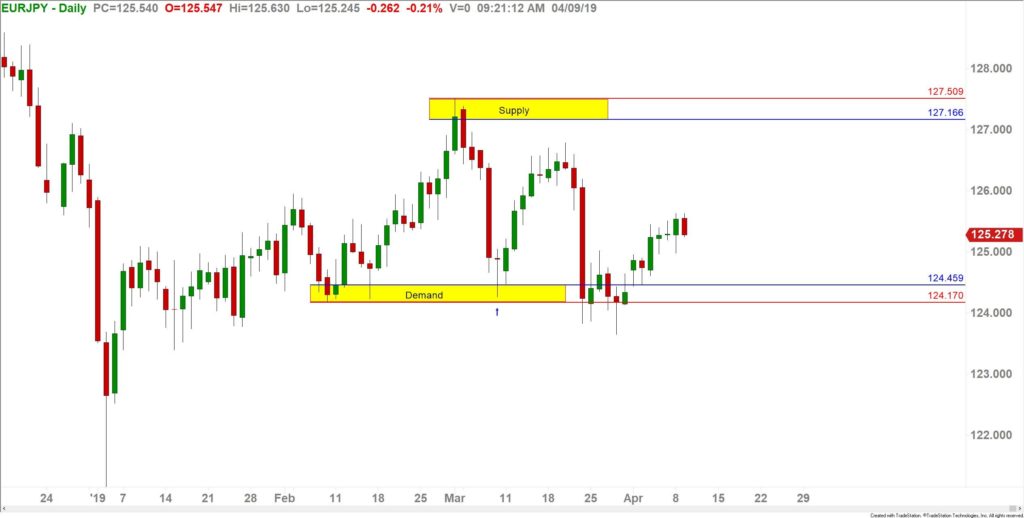
On this daily Forex chart for March 8, the EURJPY fell into an obvious demand zone from February 8. After about a two week rally, this pair fell dramatically back to our zone, which now shows us a larger time frame supply zone. We are now looking to trade between these levels.
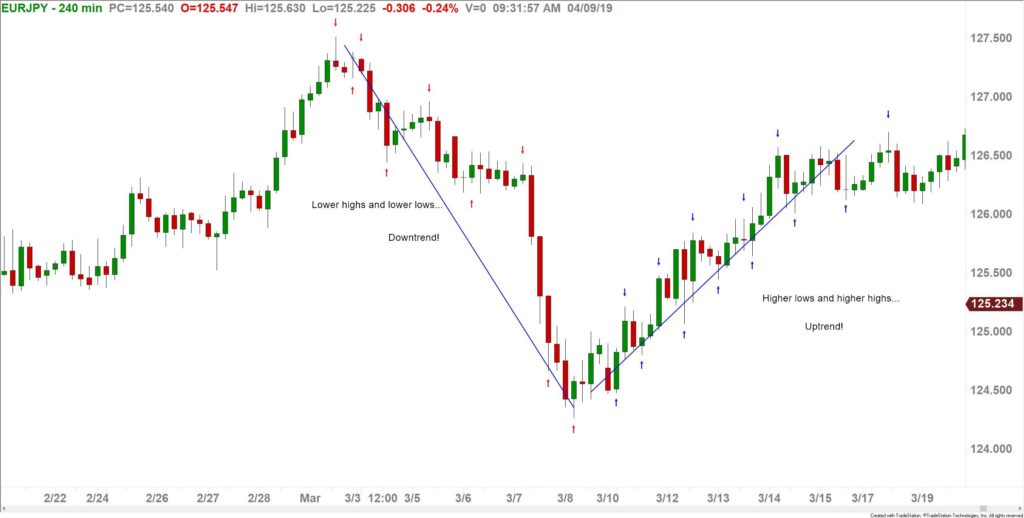
There is an obvious downtrend from March 3 to March 8 marked on this chart using a series of red arrows showing the lower highs and lower lows of the downtrend. Personally, I’m not a fan of going long in a downtrend no matter how strong the demand zone the trend hits, but many of the more aggressive traders will. To do this, your first entry could have been at the demand zone from the daily Forex chart!
As I
said, I’m waiting for the trend to change direction which is marked by the blue
arrows. When we have higher lows AND higher highs, an uptrend has formed and
it’s time to go long…but on the next time frame lower which would logically be
the 60 minute chart when using the 4, 5
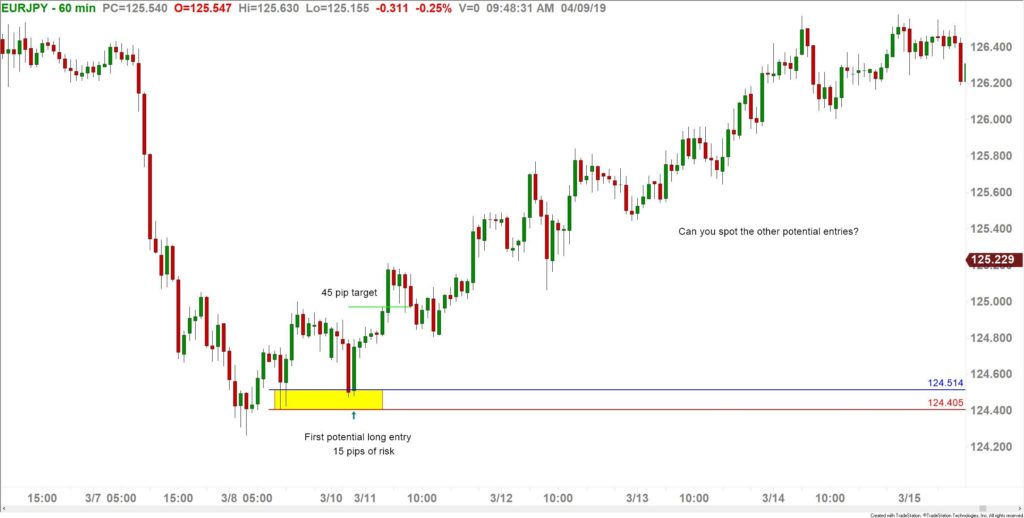
or 6 ratio. Don’t forget, we always want to use at least a 3:1 reward to risk
ratio on our trades, which has been covered quite a few times in previous
articles. Entering your long trade at approximately 124.50, with a stop below
the zone around 124.35 would have given you only 15 pips of risk. Having ONLY a
45 pip profit target on this trade would definitely have worked out, but there
was so much more room in this Forex trade if you let it run!
As you are putting your trading plan together, hopefully this helps with your multiple time frame analysis section!
Rick Wright can be contacted on this link: Rick Wright