andrewmooton
Active member
- Messages
- 192
- Likes
- 1
Hi there,
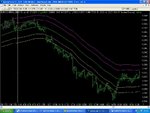
I was reading another post on t2w about the following indicators:
1. EMA
2. keltner channel - outer
3. keltner channel - inner
4. parabolic stop
5. money flow index
Apparently, these TA 'tools' can be used to generate buy and sell signals when trading intraday and i'd love to know how to use them myself.
So, if anyone here knows i'd love to know!
Thanks,
Andrew