normandysr2
Junior member
- Messages
- 11
- Likes
- 0
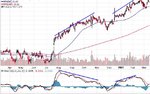
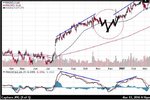
So I have a graph here of a stock (BAX) that was ranging for a good part for several months until mid July 2006 when it took off. The first MACD divergence seems to have been correct in predicting the dip at around December 2006, but then the stock continued to go in an uptrend, and this was only shown by the MACD in hindsight....So how do you trade false divergences like this where the MACD dips well below the 0 line and then shoots right back up?