We’ve all heard pundits refer to the first ten years of the new millennium as the “lost decade.” Folks who invested in a stock-index fund such as the DIAMONDS Trust Series ETF (DIA) at the beginning of 2000 and held it through December 31, 2010 saw a gross return of around zero. Factor in inflation and the real return drops to around minus 3% per year. In other words, cash was king and it would have been better to keep your money in bonds or in the bank.
Some experts, including Martin Pring author of a new book entitled Investing in the Second Lost Decade (McGraw Hill, 2012), believe that with high levels of debt, persistent high unemployment rates and economic turmoil around the globe, that there is a good chance that we will see another lost decade into the 2020s. Suffice it to say that this is not the kind of trading environment that gets a bull (like me) who eagerly awaits the next big rally, very excited.
So what are safety-conscious traders and active investors who aren’t interested in sitting on the sidelines to do in a “Cash is King” market?
Getting Paid to Play
When there is a better chance that stocks won’t be trading significantly higher in the next few months or longer, it’s important to find stocks that have a higher probability of outperforming when cash is king AND that pay you even if prices remain flat.
Defensive stocks such as utilities that can hold up reasonably well during weaker economies are one option but, if utilities stock prices stay flat, what sort of dividends do they pay? A recent check revealed annual dividend yields around 5% or lower for dividend-paying utilities trading on U.S. exchanges. Well-known names such as Duke Energy (DUK), First Energy (FE) or Allete (ALE) paid dividend yields around 4.5%. Edison International (EIX) is near the bottom of the pile and paid just 2.8%.
One sector that has been performing well this year has been real estate, specifically residential investment and commercial real estate. The combination of falling home prices and a high number of foreclosures have pushed many former or new would-be homeowners into the rental market and rents have been increasing in many areas of the country. Real Estate Investment Trusts (REITs) which hold either rental properties or mortgages on these properties have been doing very well as a result. Some also pay very generous annual dividends of 10% or more so investors get paid to own the stock even if it doesn’t go up in price.
Unlike trading short-term stock positions where the technicals alone often determine which stocks to buy and sell, finding defensive stars requires a good understanding of the fundamentals such as price-earnings ratios, revenues, current and forecasted earnings as well as dividends and dividend yields. Here are a few recent favorite stocks in which I’ve highlighted the key fundamentals that attracted me to them.
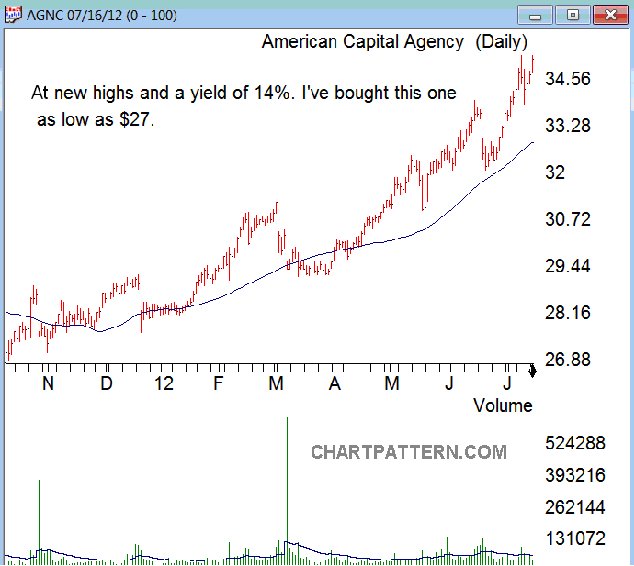
Fig 1
American Capital Agency Corporation (AGNC) – This REIT invests in leveraged mortgage securities and collateralized mortgage obligations (CMOs) which are guaranteed by government sponsored enterprises such as the Federal National Mortgage Association (Fannie Mae), Freddie Mac (Federal Home Loan Mortgage Corp) and Ginnie May (Government National Mortgage Association). As of July 10, 2012 the stock paid an annual dividend of $5.45/share for a dividend yield of $15.6%. According to VectorVest.com, the one-to-three year forecasted annual earnings growth rate is an impressive 23 percent. Growth to PE (GPE) which is the ratio of growth to the price/earnings multiple is also impressive at 3.5. Any stock trading above a GPE of 1.00 is generally considered undervalued. Sales over the last 12 months grew at a very impressive 212% and the company has a price/sales ratio of just over 7.
Investco Mortgage Capital Incorporated (IVR) – This REIT primarily invests in and manages commercial and residential mortgage-backed securities and loans. Earnings for the next 12 months are forecasted at $2.90/share and the company pays an annual dividend of $2.75 with a dividend yield of 14.75%. Its one to three year forecasted earnings growth rate is 13 percent with a GPE of 2.
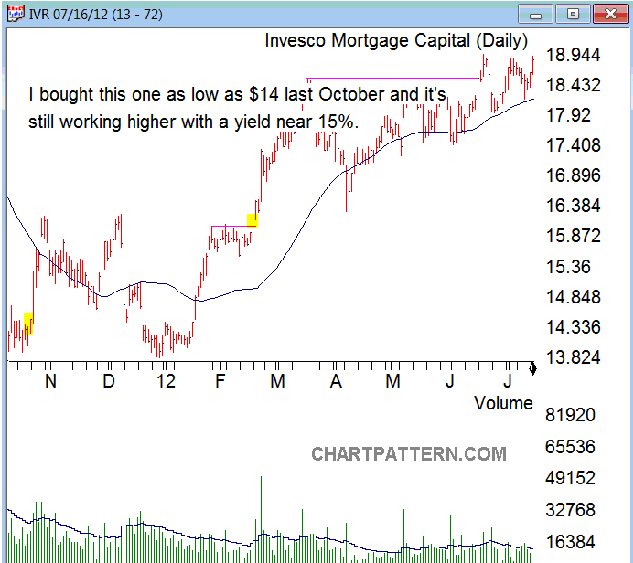
Fig 2
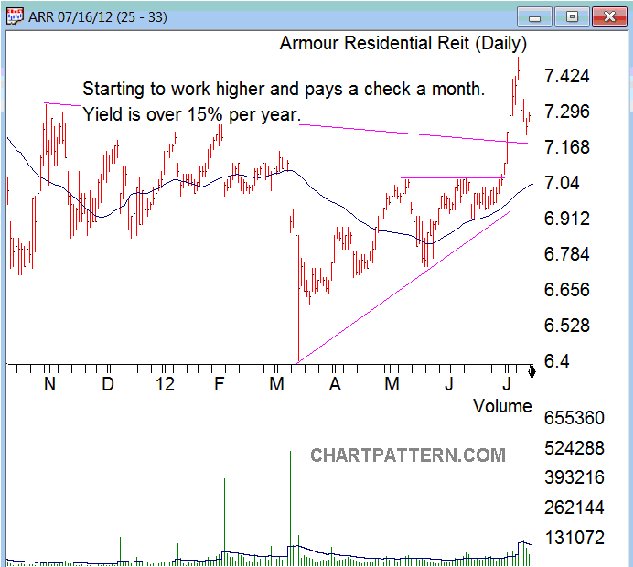
Fig 3
Armour Res Enterprise Acquisition Corporation (ARR) – This company may have the most generous annual dividend yield of the group at 16.5% but it does not have significant operations so must be considered more speculative. The company intends to acquire through a merger, stock exchange, asset acquisition an operating business. It has a leading 12-month earnings per share forecast of $0.91, forecasted one to three year earnings growth forecast of 37 percent and a GPE of 4.6. It currently pays an annual dividend of $1.20/share.
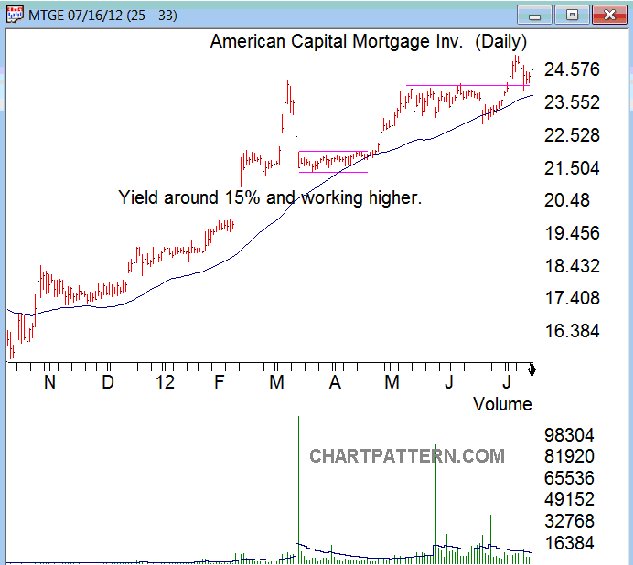
Fig 4
American Capital Mortgage Investment Corporation (MTGE) – MTGE invests and manages a leveraged portfolio of agency and non-agency mortgage and mortgage-related investments. It has 12-month forecasted earnings per share (EPS) of $3.80/share, a dividend of $3.60 for a dividend yield of 14.8%. However, earnings are not growing and the company has no sales growth which means investments presumably generate a fixed income and therefore fixed earnings. As a result, the company also has a very low GPE (0.01). It also has a higher Price/Sales ratio than its peers at 15.6.
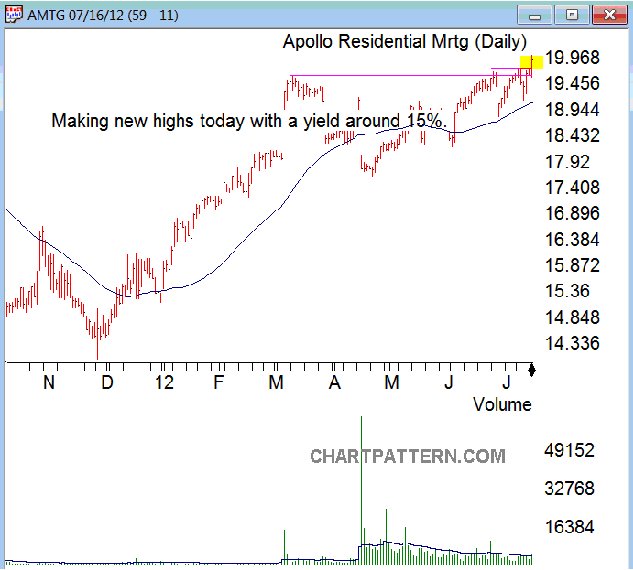
Fig 5
Apollo Residential Mortgage Incorporated (AMTG) – Formed primarily to finance, manage and invest in U.S. mortgage-backed securities (MBSs), residential mortgages and residential mortgage assets AMTG also pays an attractive dividend of $3.00 for a dividend yield of 15.3%. However, like MTGE it has no forecasted earnings or sales growth and has a negligible GPE of 0.1. It has an even higher price/sales ratio than MTGE at 20.6 according to VectorVest.com.
The “Cash Is King” Caveat
With the resurgence in the residential rental and commercial real estate markets, REITs are again making money in the current low interest rate environment. But unless the economy continues to recover, this trend could be relatively short-lived. For this reason as well as the fact that they can be volatile, these stocks are not intended as ‘buy and forget’ investments. It pays to watch them closely because you never know when some event could cause them to drop unexpectedly.
Two more factors are very important. First, whenever entering or exiting a stock it’s essential to watch the chart patterns. If you see a bearish chart pattern setting up on any of these stocks it’s safer to exit first and ask questions later. Identifying chart patterns is simply a system for predicting stock market trends and turns. Hundreds of years of price charts have shown that prices tend to move in trends. (I'm sure we've all heard the saying, 'the trend is your friend'.) Well, a trend is merely an indicator of an imbalance in supply and demand. These changes can usually be seen by market action through changes in price. These price changes often form meaningful chart patterns that can act as signals in trying to determine possible future trend developments. Research has proven that some patterns have high forecasting probabilities. These patterns include: The Cup & Handle, Flat Base, Ascending and Descending Triangles, Parabolic Curves, Symmetrical Triangles, Wedges, Flags and Pennants, Channels and the Head and Shoulders Patterns. In my opinion, these are some of the best patterns to trade.
The second important factor is to have concrete written trading rules which you follow come what may. This includes employing specific stop-loss levels – the pre-determined price at which you exit your positions – no matter what.
REIT Wrap-Up
Real estate remains a risky proposition and challenges remain, especially for new homebuilders who must compete against a huge inventory of foreclosures and unsold homes in many markets. But these challenges have created opportunities in other areas of the real estate business which includes residential rental and commercial markets.
Real estate investment trusts and companies in related businesses offer opportunities to make money even if U.S. stocks don’t rally significantly higher. By learning which REITs have the best potential to benefit and that pay the most attractive dividends, traders and investors can continue to make money by using the most powerful chart patterns and following a few simple rules.
This information contained in this article is for educational purposes only and is not intended as trading or investment advice. All information provided in this article is believed to be correct but readers are advised to check the latest fundamental data such as earnings, revenues and forecasts independently to insure accuracy.
Dan Zanger can be contacted at ChartPattern.com
Some experts, including Martin Pring author of a new book entitled Investing in the Second Lost Decade (McGraw Hill, 2012), believe that with high levels of debt, persistent high unemployment rates and economic turmoil around the globe, that there is a good chance that we will see another lost decade into the 2020s. Suffice it to say that this is not the kind of trading environment that gets a bull (like me) who eagerly awaits the next big rally, very excited.
So what are safety-conscious traders and active investors who aren’t interested in sitting on the sidelines to do in a “Cash is King” market?
Getting Paid to Play
When there is a better chance that stocks won’t be trading significantly higher in the next few months or longer, it’s important to find stocks that have a higher probability of outperforming when cash is king AND that pay you even if prices remain flat.
Defensive stocks such as utilities that can hold up reasonably well during weaker economies are one option but, if utilities stock prices stay flat, what sort of dividends do they pay? A recent check revealed annual dividend yields around 5% or lower for dividend-paying utilities trading on U.S. exchanges. Well-known names such as Duke Energy (DUK), First Energy (FE) or Allete (ALE) paid dividend yields around 4.5%. Edison International (EIX) is near the bottom of the pile and paid just 2.8%.
One sector that has been performing well this year has been real estate, specifically residential investment and commercial real estate. The combination of falling home prices and a high number of foreclosures have pushed many former or new would-be homeowners into the rental market and rents have been increasing in many areas of the country. Real Estate Investment Trusts (REITs) which hold either rental properties or mortgages on these properties have been doing very well as a result. Some also pay very generous annual dividends of 10% or more so investors get paid to own the stock even if it doesn’t go up in price.
Unlike trading short-term stock positions where the technicals alone often determine which stocks to buy and sell, finding defensive stars requires a good understanding of the fundamentals such as price-earnings ratios, revenues, current and forecasted earnings as well as dividends and dividend yields. Here are a few recent favorite stocks in which I’ve highlighted the key fundamentals that attracted me to them.

Fig 1
American Capital Agency Corporation (AGNC) – This REIT invests in leveraged mortgage securities and collateralized mortgage obligations (CMOs) which are guaranteed by government sponsored enterprises such as the Federal National Mortgage Association (Fannie Mae), Freddie Mac (Federal Home Loan Mortgage Corp) and Ginnie May (Government National Mortgage Association). As of July 10, 2012 the stock paid an annual dividend of $5.45/share for a dividend yield of $15.6%. According to VectorVest.com, the one-to-three year forecasted annual earnings growth rate is an impressive 23 percent. Growth to PE (GPE) which is the ratio of growth to the price/earnings multiple is also impressive at 3.5. Any stock trading above a GPE of 1.00 is generally considered undervalued. Sales over the last 12 months grew at a very impressive 212% and the company has a price/sales ratio of just over 7.
Investco Mortgage Capital Incorporated (IVR) – This REIT primarily invests in and manages commercial and residential mortgage-backed securities and loans. Earnings for the next 12 months are forecasted at $2.90/share and the company pays an annual dividend of $2.75 with a dividend yield of 14.75%. Its one to three year forecasted earnings growth rate is 13 percent with a GPE of 2.

Fig 2

Fig 3
Armour Res Enterprise Acquisition Corporation (ARR) – This company may have the most generous annual dividend yield of the group at 16.5% but it does not have significant operations so must be considered more speculative. The company intends to acquire through a merger, stock exchange, asset acquisition an operating business. It has a leading 12-month earnings per share forecast of $0.91, forecasted one to three year earnings growth forecast of 37 percent and a GPE of 4.6. It currently pays an annual dividend of $1.20/share.

Fig 4
American Capital Mortgage Investment Corporation (MTGE) – MTGE invests and manages a leveraged portfolio of agency and non-agency mortgage and mortgage-related investments. It has 12-month forecasted earnings per share (EPS) of $3.80/share, a dividend of $3.60 for a dividend yield of 14.8%. However, earnings are not growing and the company has no sales growth which means investments presumably generate a fixed income and therefore fixed earnings. As a result, the company also has a very low GPE (0.01). It also has a higher Price/Sales ratio than its peers at 15.6.

Fig 5
Apollo Residential Mortgage Incorporated (AMTG) – Formed primarily to finance, manage and invest in U.S. mortgage-backed securities (MBSs), residential mortgages and residential mortgage assets AMTG also pays an attractive dividend of $3.00 for a dividend yield of 15.3%. However, like MTGE it has no forecasted earnings or sales growth and has a negligible GPE of 0.1. It has an even higher price/sales ratio than MTGE at 20.6 according to VectorVest.com.
The “Cash Is King” Caveat
With the resurgence in the residential rental and commercial real estate markets, REITs are again making money in the current low interest rate environment. But unless the economy continues to recover, this trend could be relatively short-lived. For this reason as well as the fact that they can be volatile, these stocks are not intended as ‘buy and forget’ investments. It pays to watch them closely because you never know when some event could cause them to drop unexpectedly.
Two more factors are very important. First, whenever entering or exiting a stock it’s essential to watch the chart patterns. If you see a bearish chart pattern setting up on any of these stocks it’s safer to exit first and ask questions later. Identifying chart patterns is simply a system for predicting stock market trends and turns. Hundreds of years of price charts have shown that prices tend to move in trends. (I'm sure we've all heard the saying, 'the trend is your friend'.) Well, a trend is merely an indicator of an imbalance in supply and demand. These changes can usually be seen by market action through changes in price. These price changes often form meaningful chart patterns that can act as signals in trying to determine possible future trend developments. Research has proven that some patterns have high forecasting probabilities. These patterns include: The Cup & Handle, Flat Base, Ascending and Descending Triangles, Parabolic Curves, Symmetrical Triangles, Wedges, Flags and Pennants, Channels and the Head and Shoulders Patterns. In my opinion, these are some of the best patterns to trade.
The second important factor is to have concrete written trading rules which you follow come what may. This includes employing specific stop-loss levels – the pre-determined price at which you exit your positions – no matter what.
REIT Wrap-Up
Real estate remains a risky proposition and challenges remain, especially for new homebuilders who must compete against a huge inventory of foreclosures and unsold homes in many markets. But these challenges have created opportunities in other areas of the real estate business which includes residential rental and commercial markets.
Real estate investment trusts and companies in related businesses offer opportunities to make money even if U.S. stocks don’t rally significantly higher. By learning which REITs have the best potential to benefit and that pay the most attractive dividends, traders and investors can continue to make money by using the most powerful chart patterns and following a few simple rules.
This information contained in this article is for educational purposes only and is not intended as trading or investment advice. All information provided in this article is believed to be correct but readers are advised to check the latest fundamental data such as earnings, revenues and forecasts independently to insure accuracy.
Dan Zanger can be contacted at ChartPattern.com
Last edited by a moderator:
