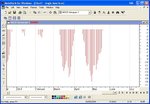
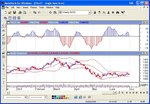
I'm interested in the colourful MACD histogram indicator mentioned here: http://www.chartfilter.com/reports/c22b.htm
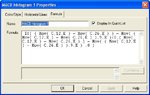
How do I create such an indicator in MS 8.1?
Thank you 🙂
Webmal
How do I create such an indicator in MS 8.1?
Thank you 🙂
Webmal