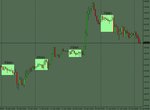
Hi,
I'm trying to write a program to highlight the high and low of the portion of chart within certain period of time of the day using "highest() and lowest()" functions as below:
Time Frame: 1hr
Starting bar: 0000hr
Ending bar: 0900hr
highligh the high-low range with range value within this time range everyday or
plot an indicator of simple "1","-1" and "0" if the high-low range is more than certain value (say 100pips), ie: if (high-low) >=100 then "1" else "-1", the less of the time will plot as "0".
See attached chart for the result.
Pls help
Regards,
Toyogo