DarrO
Junior member
- Messages
- 17
- Likes
- 0
Hardcore Scalping Project
Main idea of this journal is to check how long I'm able to keep up to a plan created by a mathematical formula assuming that I make profit at level 1, 3 or 5% daily.
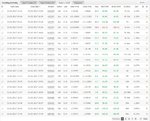
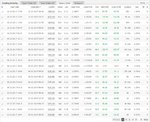
I made a chart in excel which shows planned results for those three variants.
It's a compound interest formula in which variables are :
-start date
-initial capital
-amount of lots for trade
-planned daily profit in %
The column "Pips" shows the amount of pips you need to get to achieve assumed daily profit.
What gave me this table?
I realized that earning only 4-5 pips a day, trading 0.1 lot at the capital 1000 PLN you can achieve growth rate of 22% per month. Because it is intended to be an experiment called "Hardcore Scalping" - I will try to trade according to column for 5%, hoping that I will keep pace for column 3% and probably ending at 1% 😛.
The project will end in case of reaching 10 000 PLN or loosing the whole capital.
I am aware that the project can end up with a disaster, that's why I risk a small amount ( 1000PLN=400 USD) , which will be a low price to pay for valuable experience in the Forex market.
The experiment began on December 29, with 1000 PLN transferred on brokers account.
According to the table at the end of the month 27-01-2017 (20 days = 4 weeks of the experiment), depending on the expected growth in % daily I should achieve:
• 1% - 1220 PLN or 122% of the initial capital
• 3% - 1806 PLN or 181% "
• 5% - 2653 PLN or 265% "
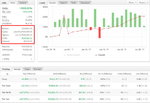
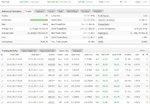
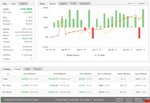
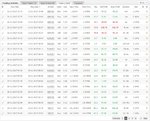
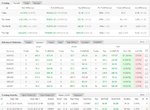
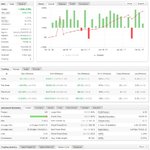
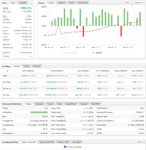
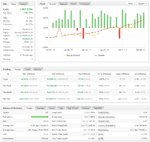
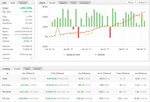
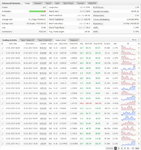
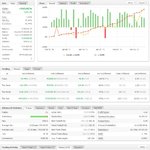
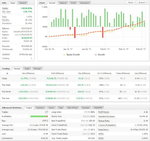
Actual balance after 1 month (20 trading days =28-01-2017) is 3061 PLN as shown in printscreen from myfxbook .
It means that in first month plan was reached ,even exceeded by 400 PLN.
This surplus will be helpful in case of coming sooner or later losses 😉
I will make reports here every few days ,obligatory on weekends.
Attachments
Last edited:


